I redesigned a system to enhance user
engagement and derive meaningful insights.
Throughout the redesign process, my goal was to redesign ThoughtNav to be mobile responsive while motivating participants and researchers to complete necessary tasks.
Using the research gathered during phase one, I was able to identify user needs, struggles, and pain points, which helped design a solution that provides a rewarding experience for each user from beginning to end.
After months of working through this process I was positioned to deliver a successful design to my stakeholders that met their unique needs and addressed problems they were struggling with for than a decade. They were highly pleased with the output of this effort and it made the journey getting so worth it.
Throughout the redesign process, my goal was to redesign ThoughtNav to be mobile responsive while motivating participants and researchers to complete necessary tasks - our user research results indicate that we were successful in this area. A rewarding experience for each user was delivered from beginning to end.
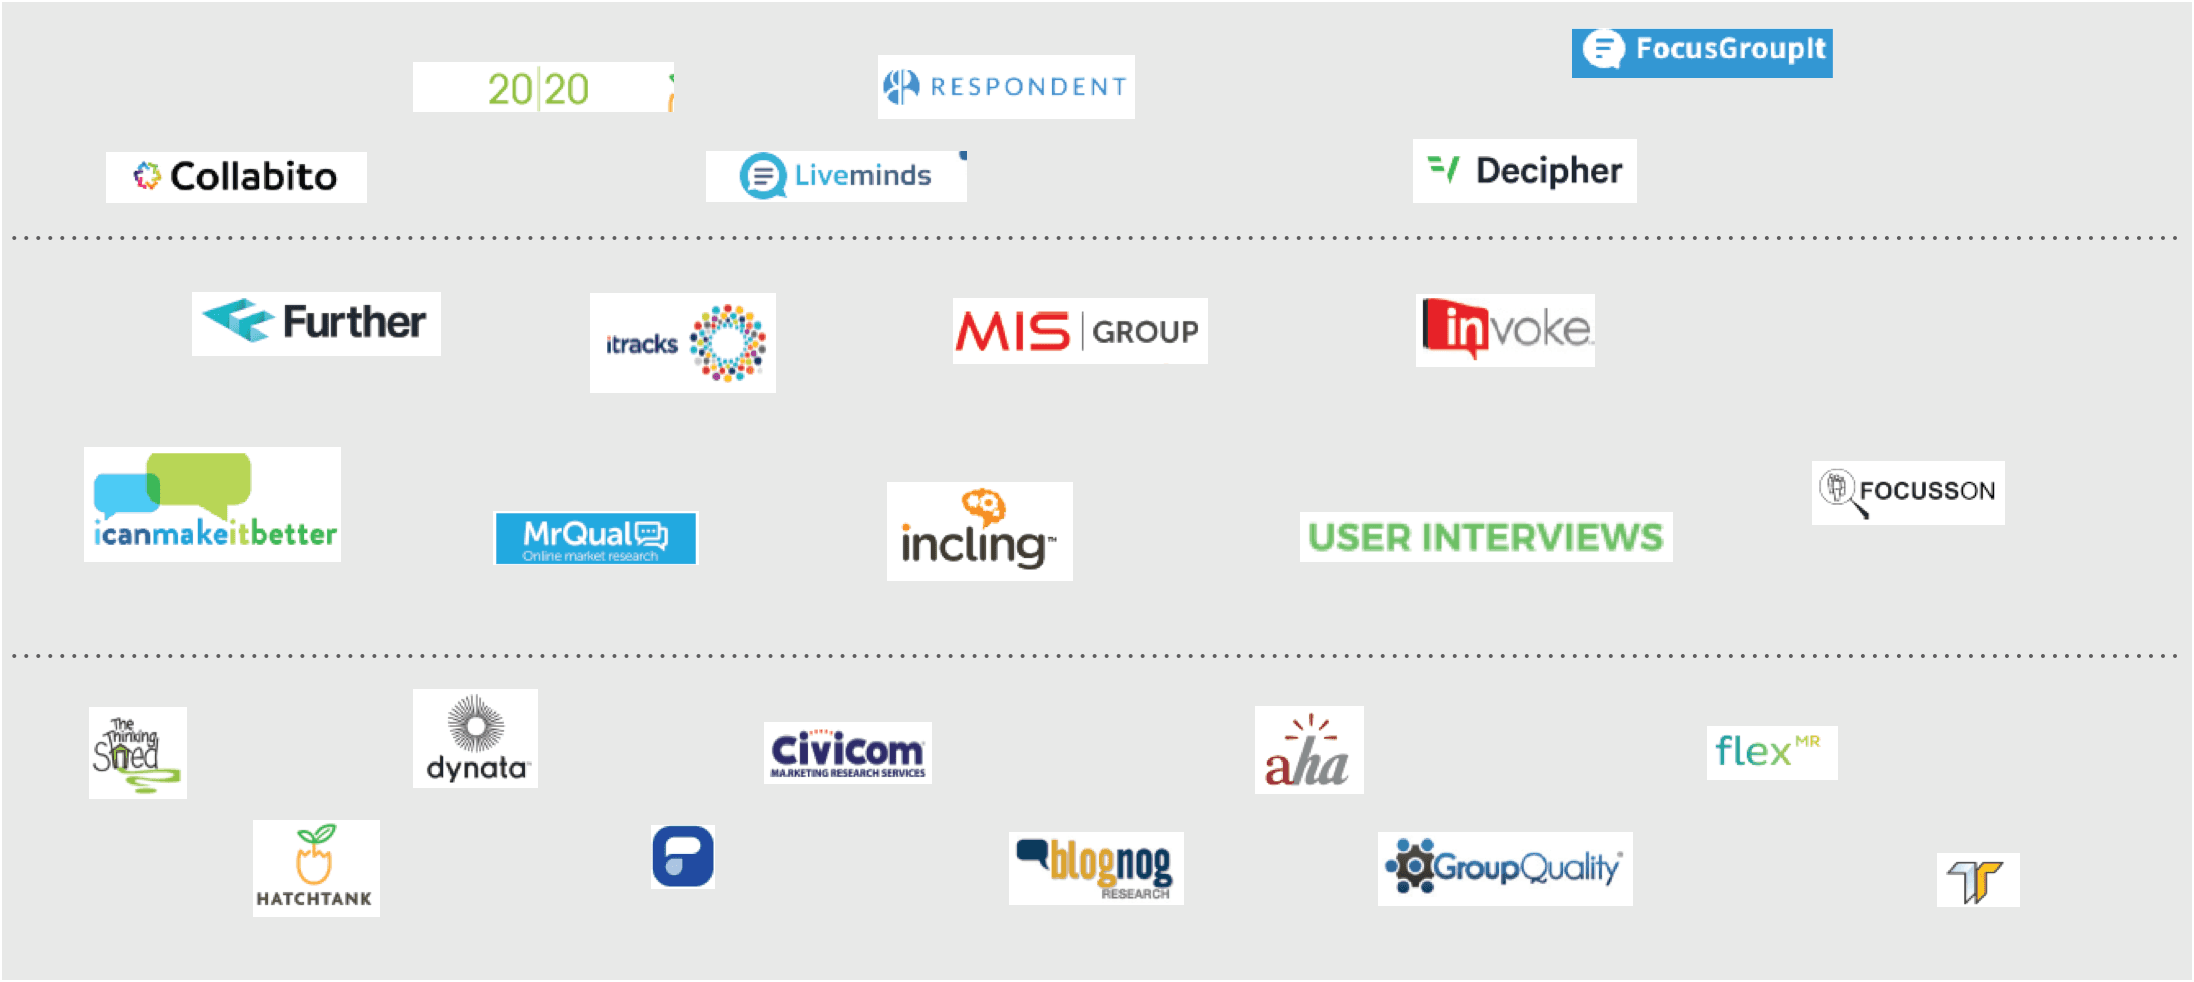
During phase one, the UT Dallas Design team performed a competitive analysis of 25 comparable products to better understand how modern systems approach facilitating online focus groups.
The analysis helped determine potential features and identified how ThoughtNav compared to similar products. I learned that some platforms are free, with few features and functions, while others are prohibitively expensive for small companies like Aperio Insights, with costs ranging between $50 to $2499 annually. For example, Collabito provides a highly developed and comprehensive system for managing studies and participants, but the platform charges roughly $330 per project.
After learning this information the UT Dallas Design team performed a heuristic analysis of Collabito to gain a better understanding about how ThoughtNav would perform against a modern system.
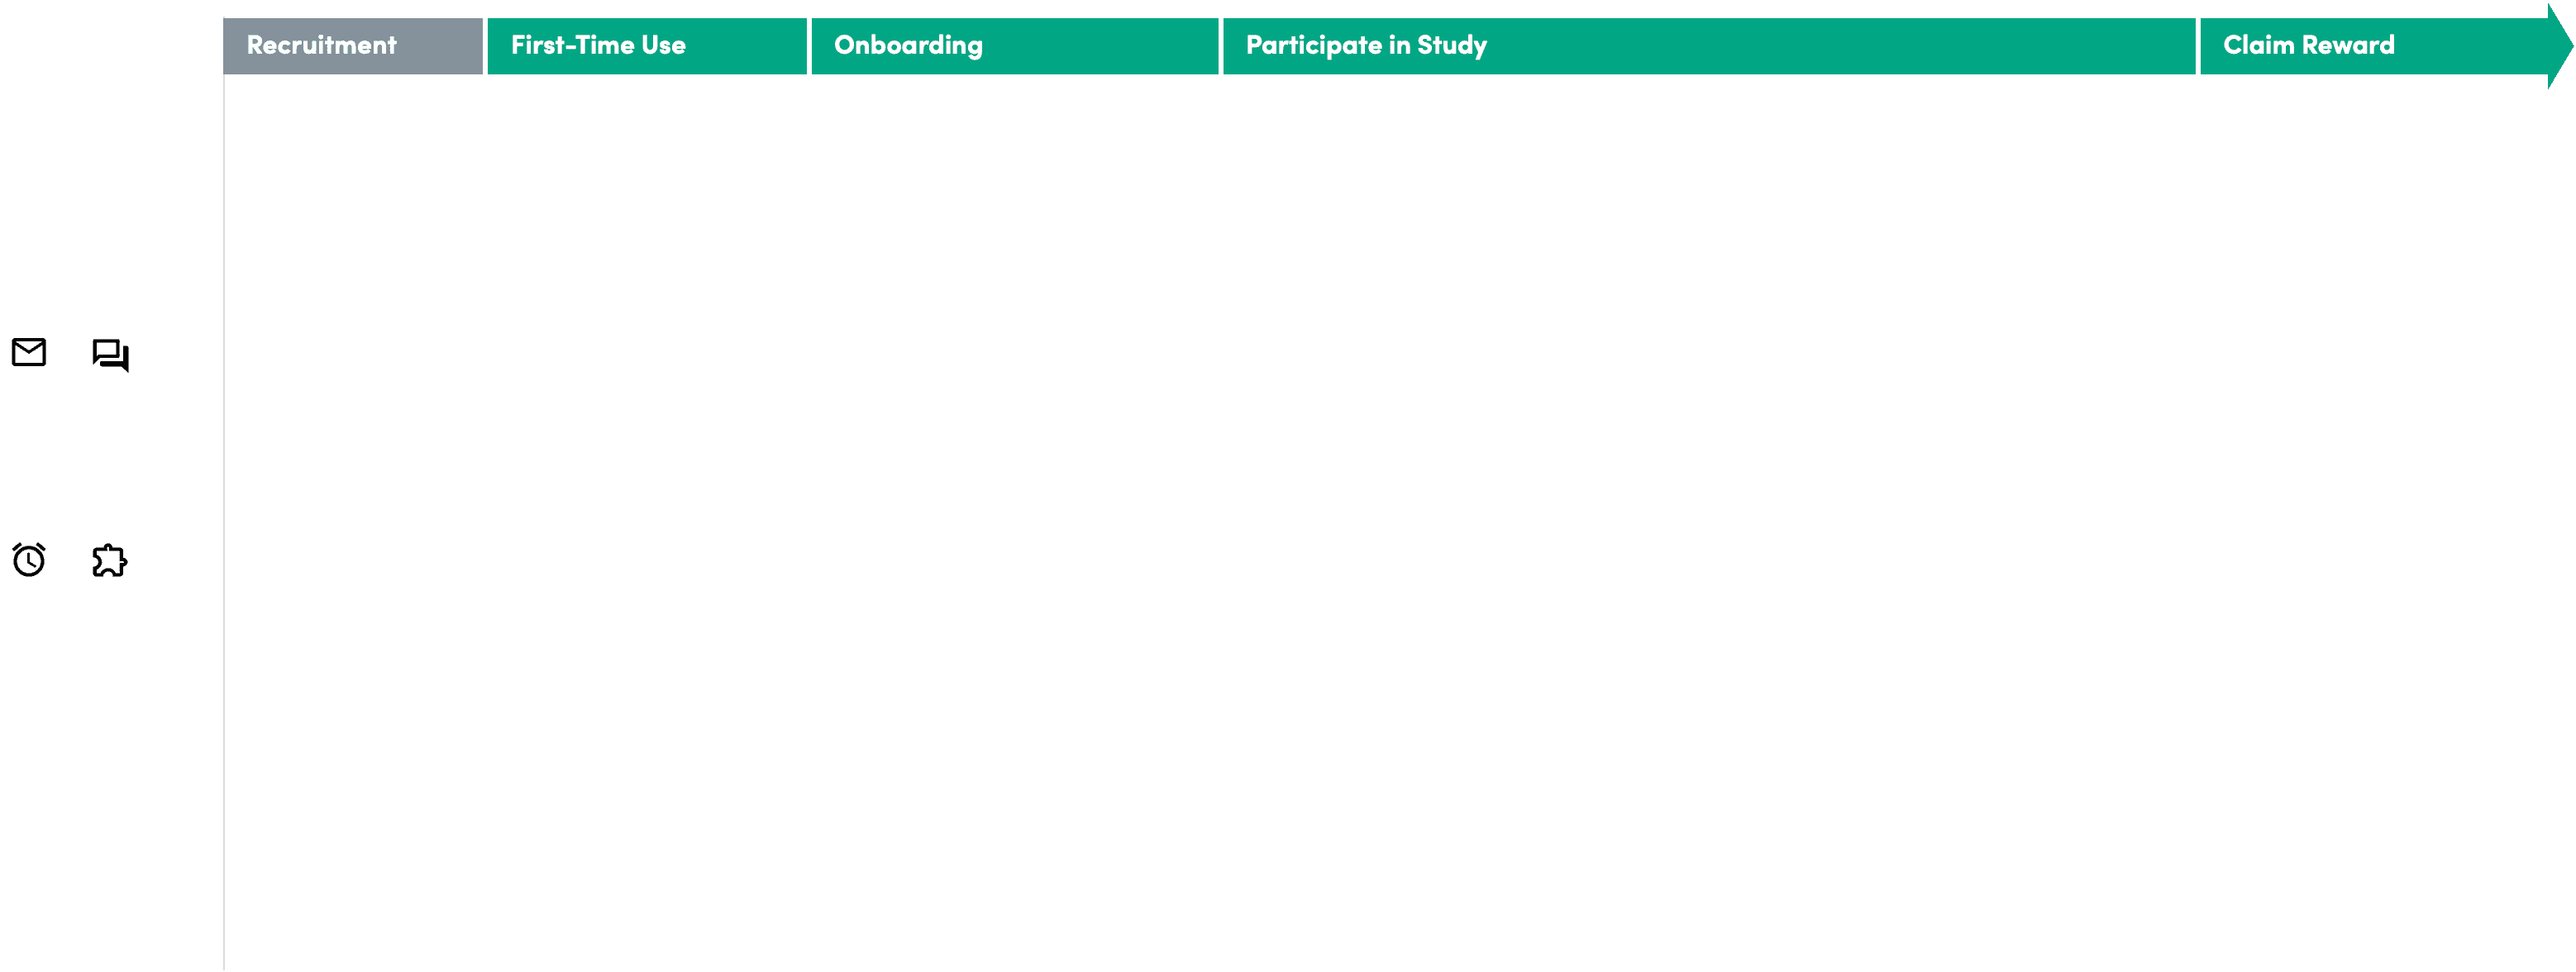
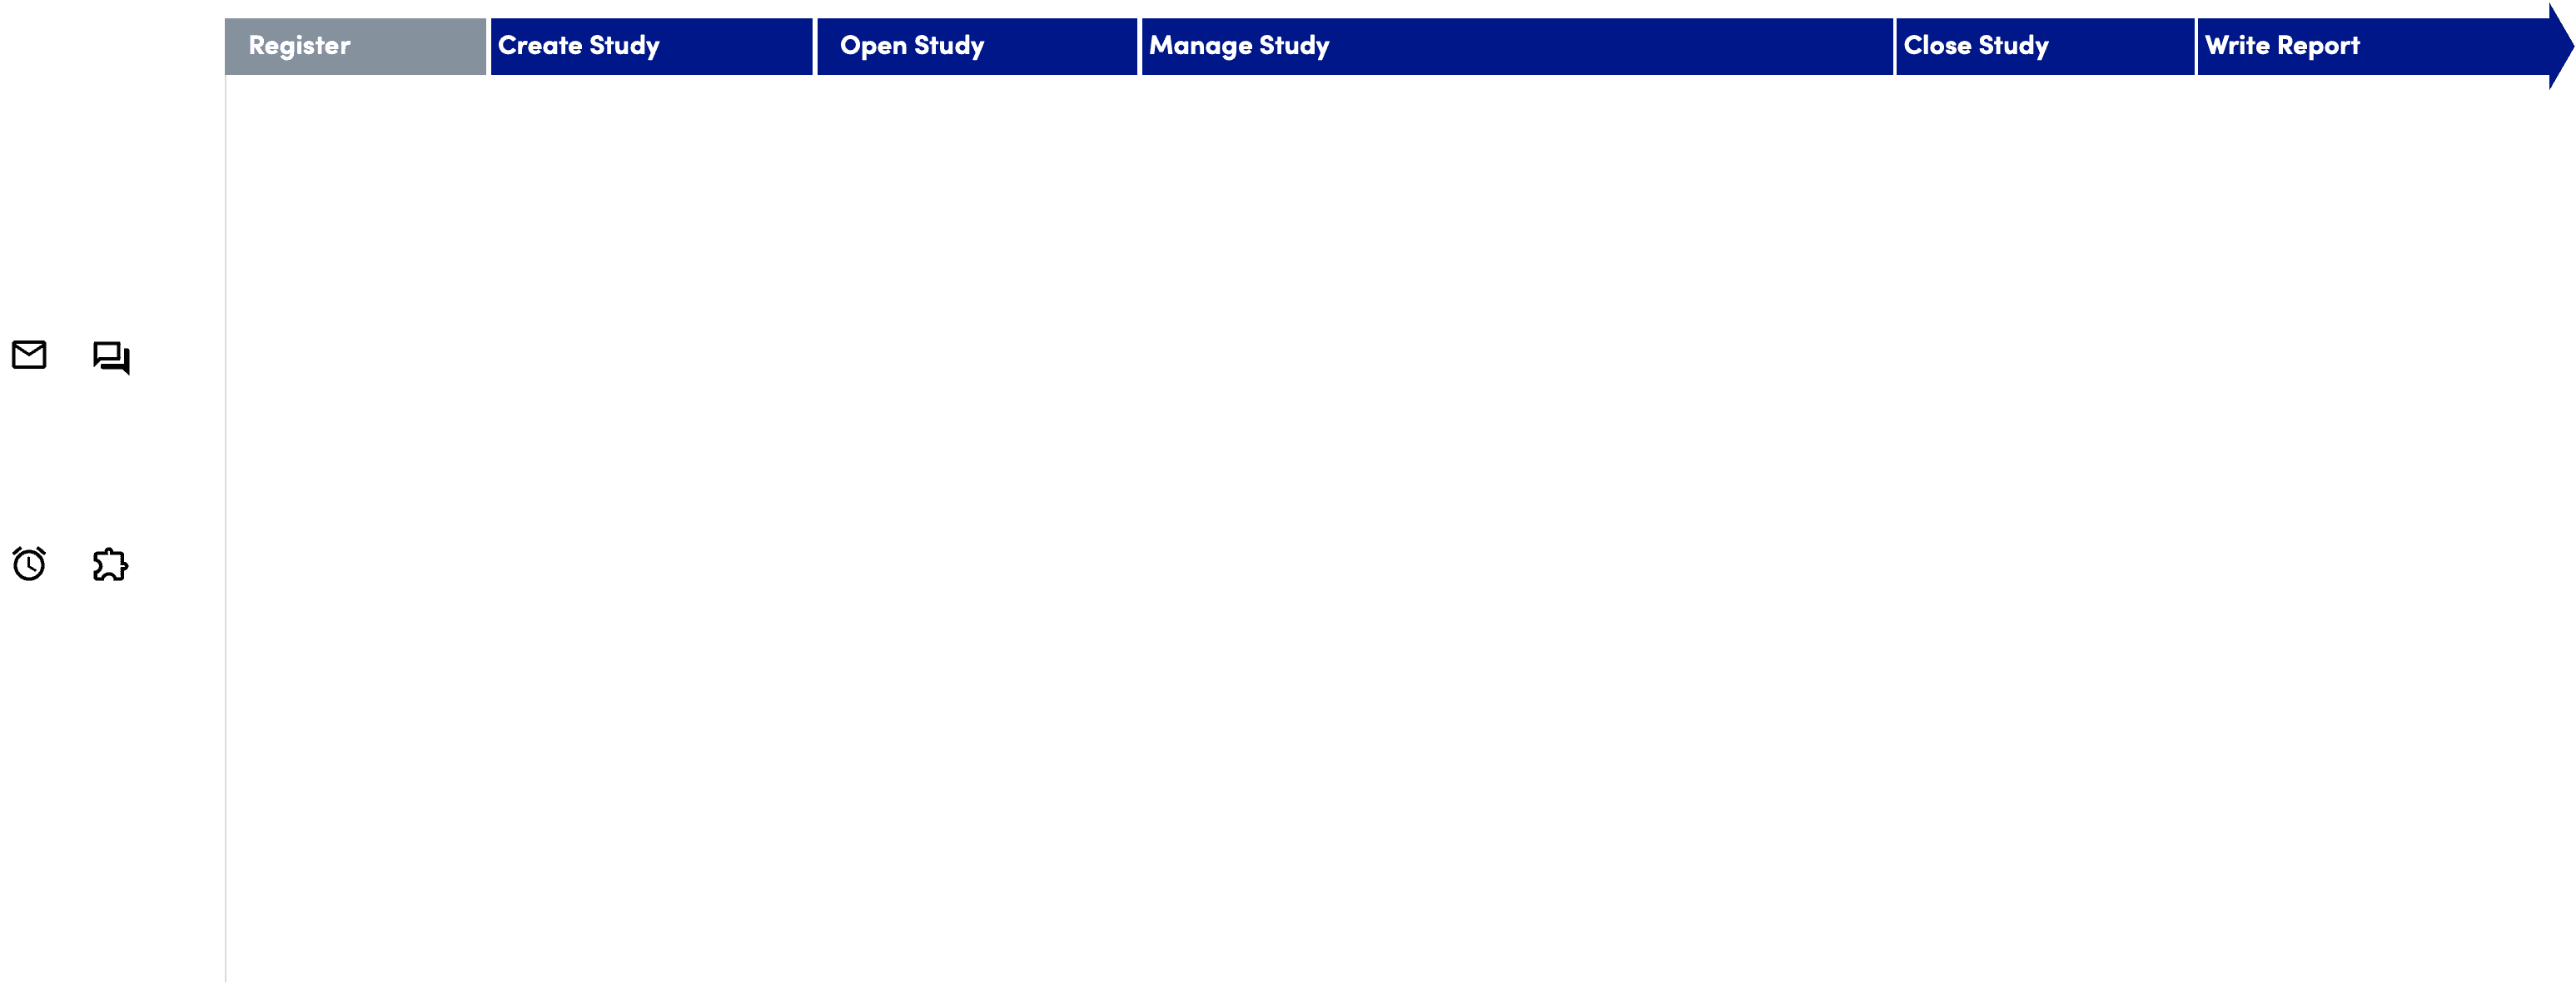
This is an overview of the user journey for participants and researchers.
During the Pre-Study phase, researchers typically recruit participants via 3rd party services, prepare questions, and configure reward methods.
The bulk of the participant experience occurs within the Study phase. During the Study Phase, participants will set up their account, go through a brief onboarding experience, answer questions, and like/comment on their group members posts.
When participants reach the Post-Study phase they can claim a reward in the form of an Amazon or PayPal gift card. Researchers require the ability to choose the type of reward method offered during each study.
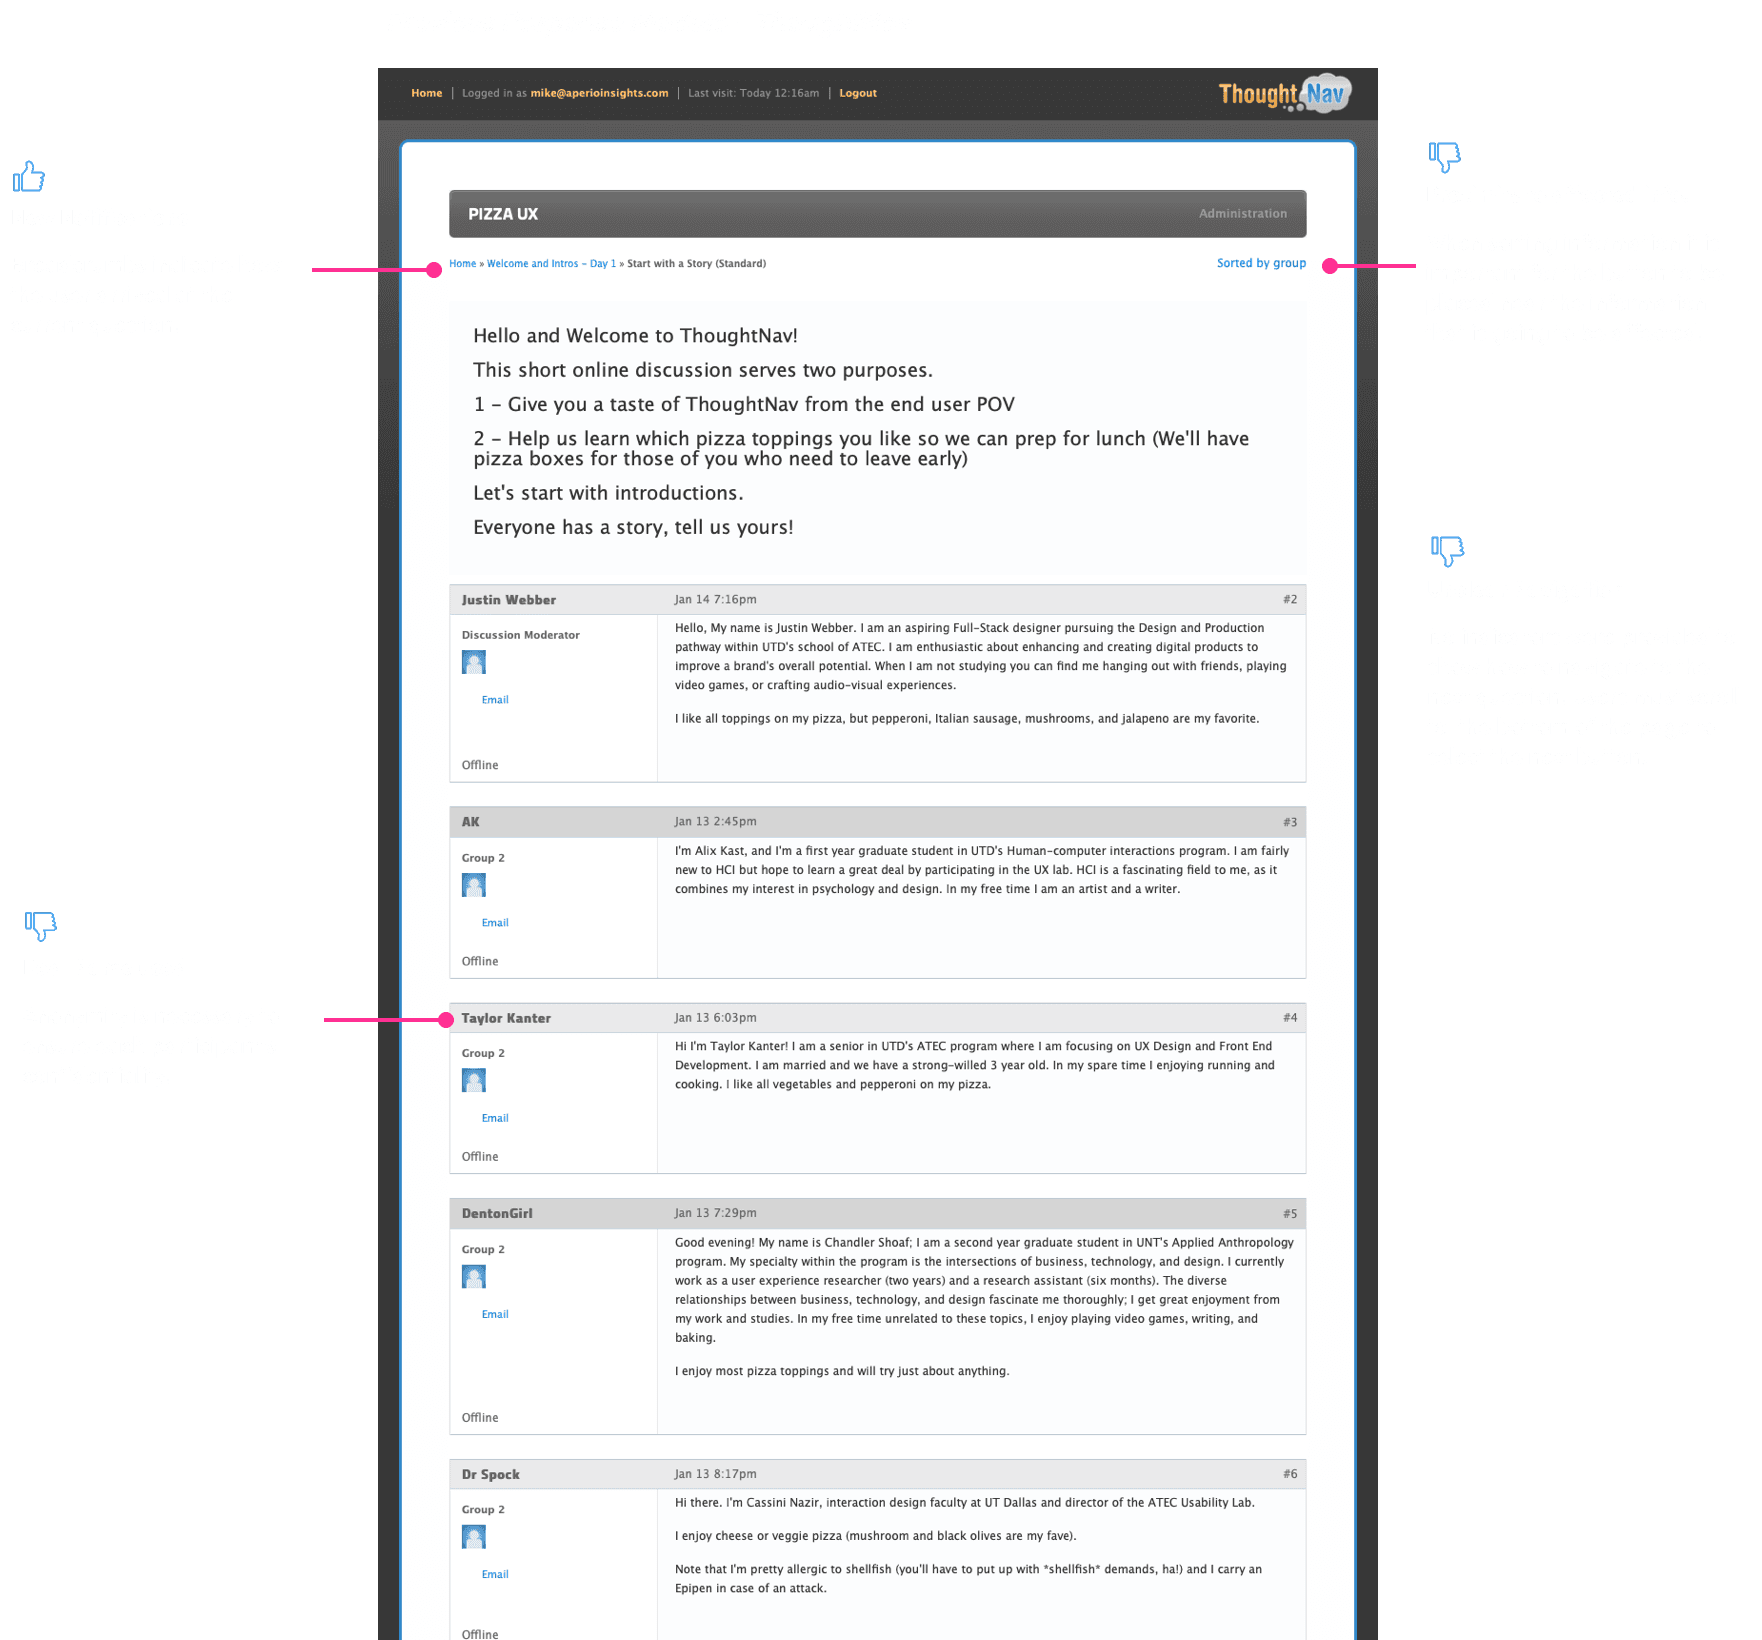
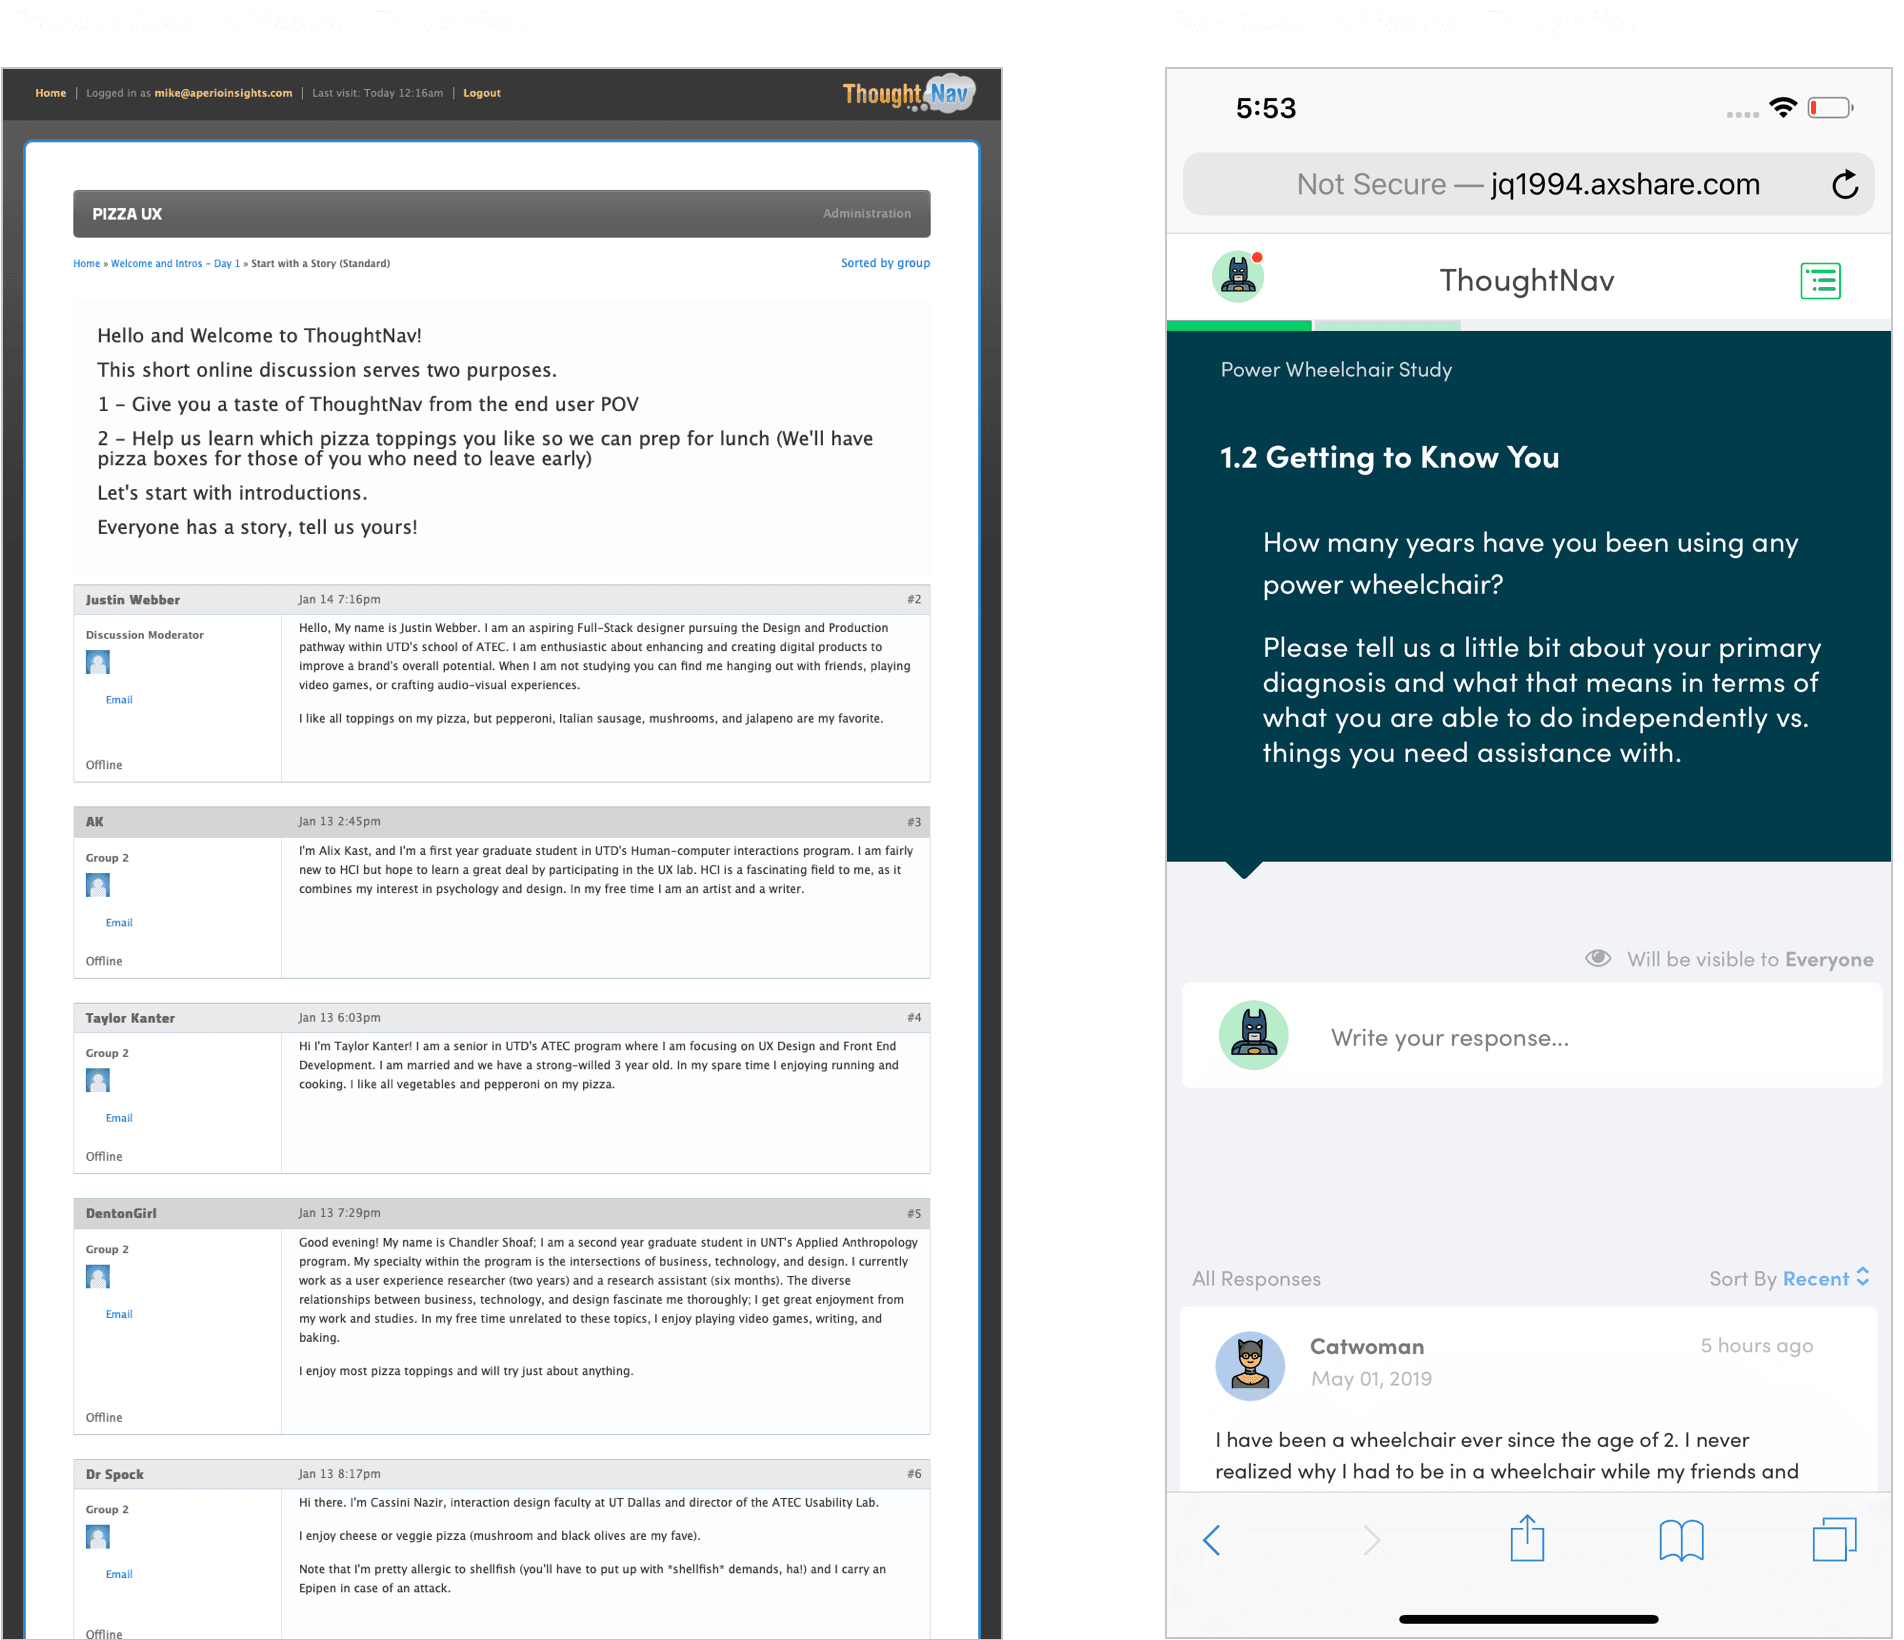
ThoughtNav's previous architecture was a disjointed and confusing experience.
No Login button exists on the public-facing website which makes it difficult for users to reenter the system without using a direct link to the study.
Researchers who wish to create or access a study must memorize the page URL.
Researchers who are able to create a new study must then navigate four links that have been labeled as Administration to configure and manage the study.
The ideation phase was a key factor for successfully redesigning ThoughtNav.
During the ideation process I referenced the data collected during the competitive analysis to incorporate interaction patterns that were used successfully in other systems. By referencing designs that are currently on the market I was able to read through customer reviews and pinpoint specific features users appreciated in other platforms to test how they would perform within ThoughtNav's system.
This process was essential for adhering to one of the key principles of UX known as Jakob's Law. The law states that user's spend most of their time on other sites, so they expect new experiences to operate in a similar manner. The data assisted with the ideation and rapid prototyping phases because there were a broad range of features to consider implementing in ThoughtNav's new design.
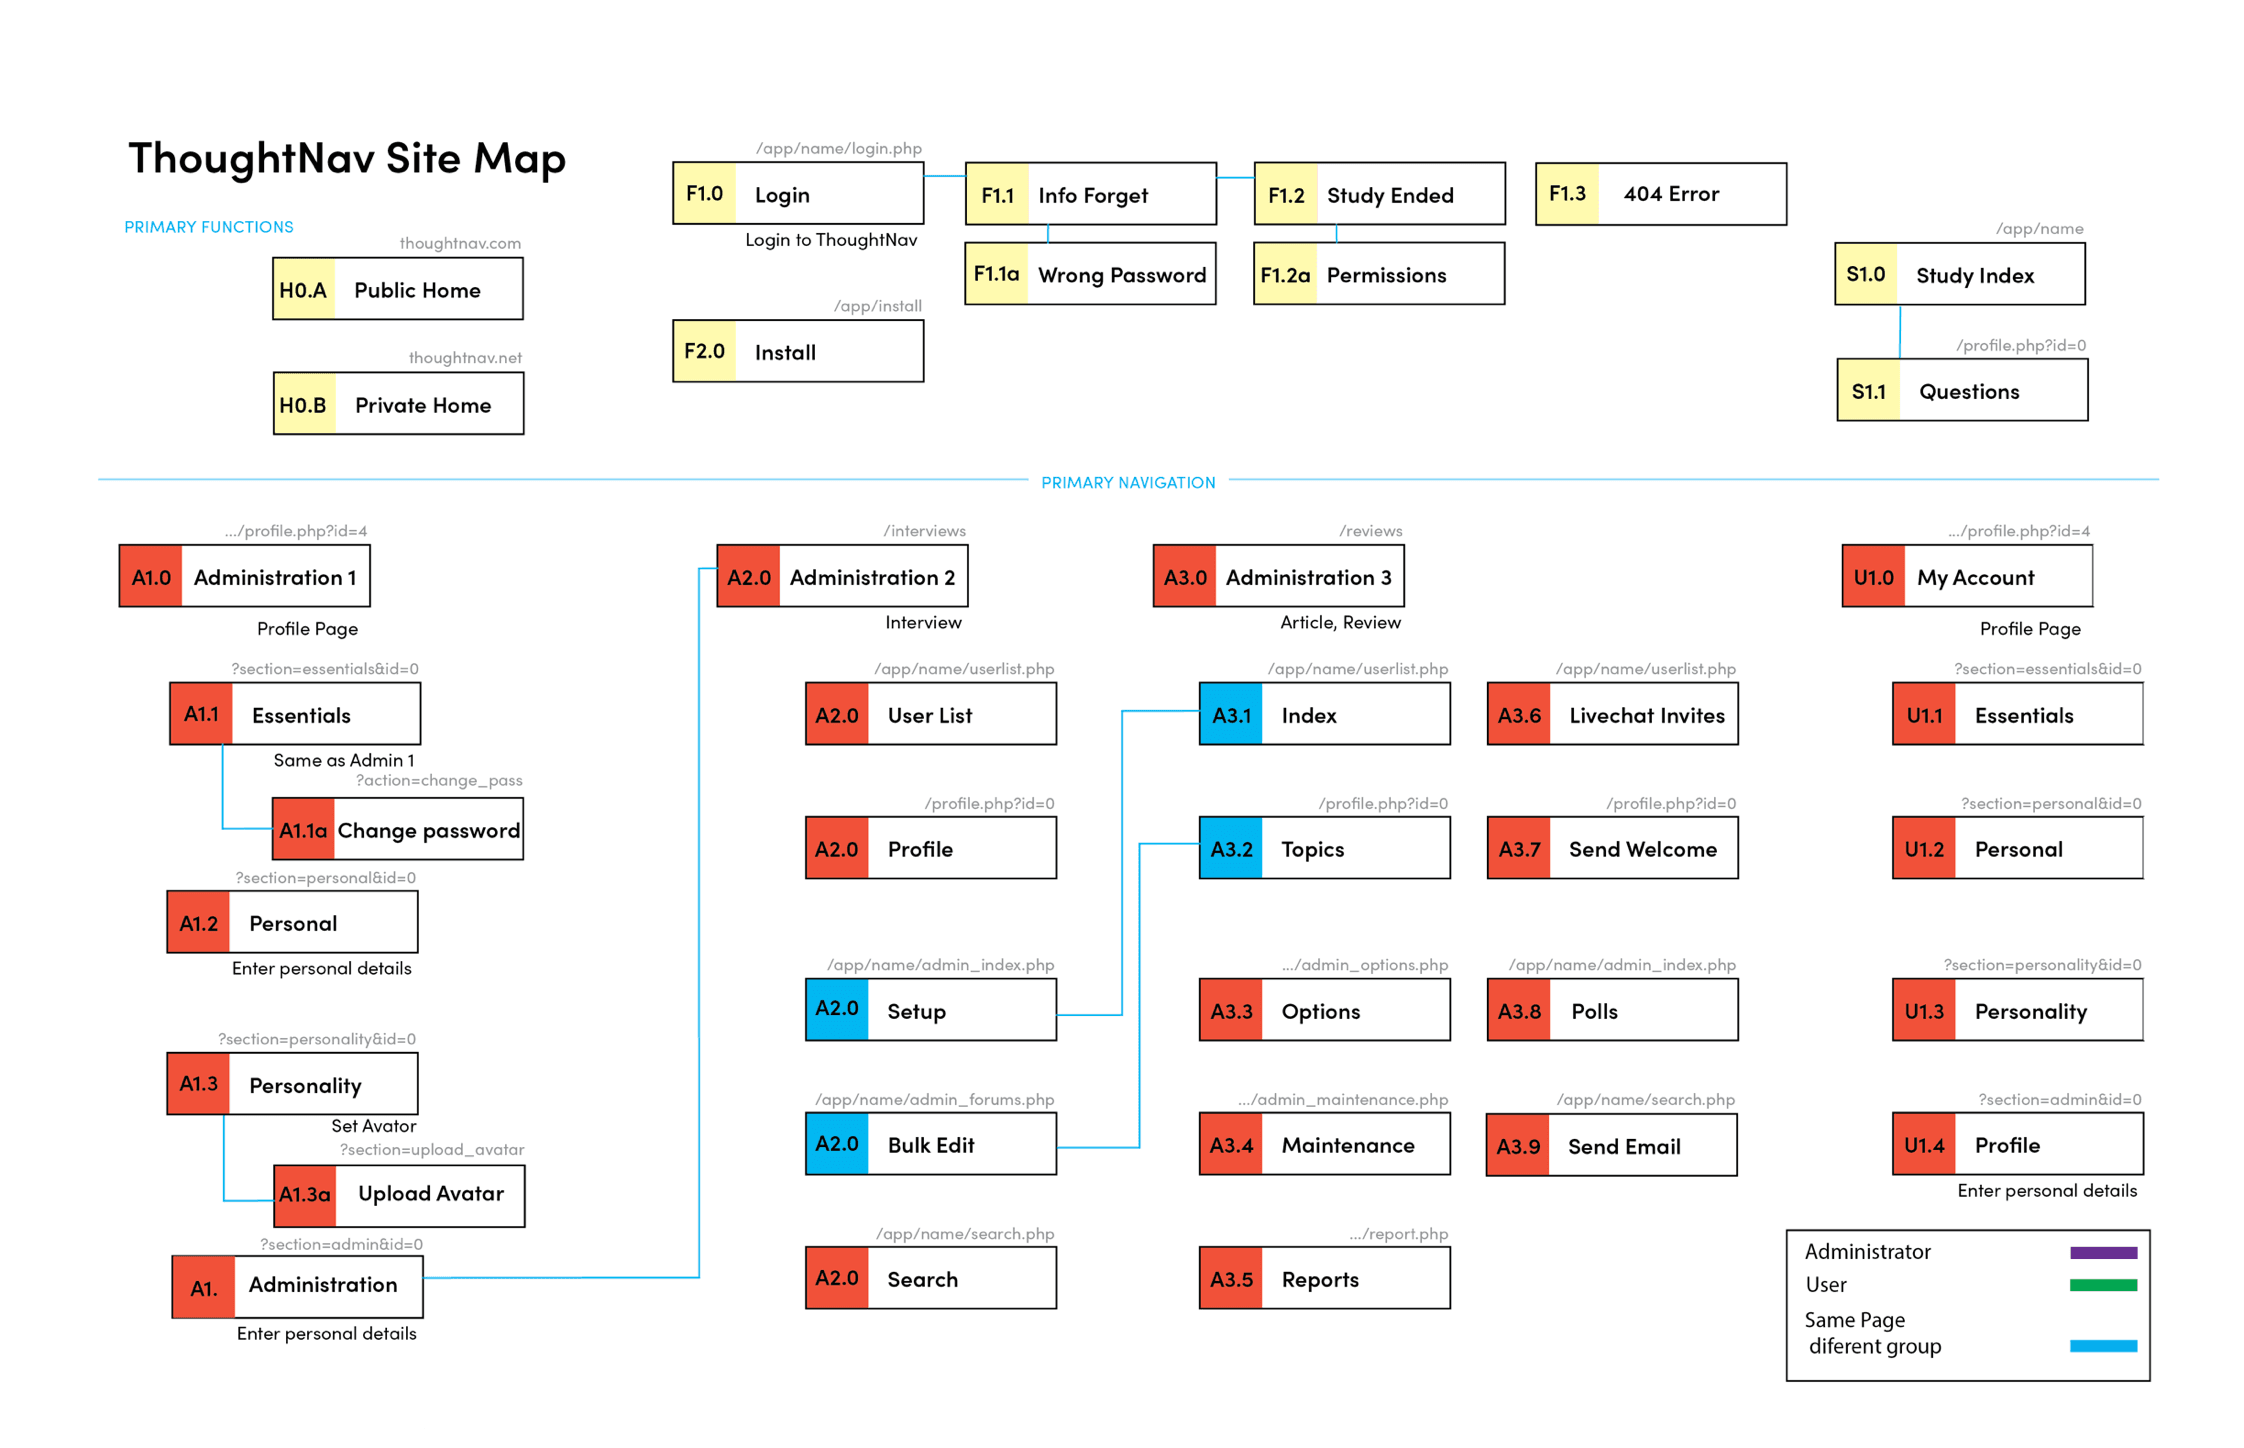
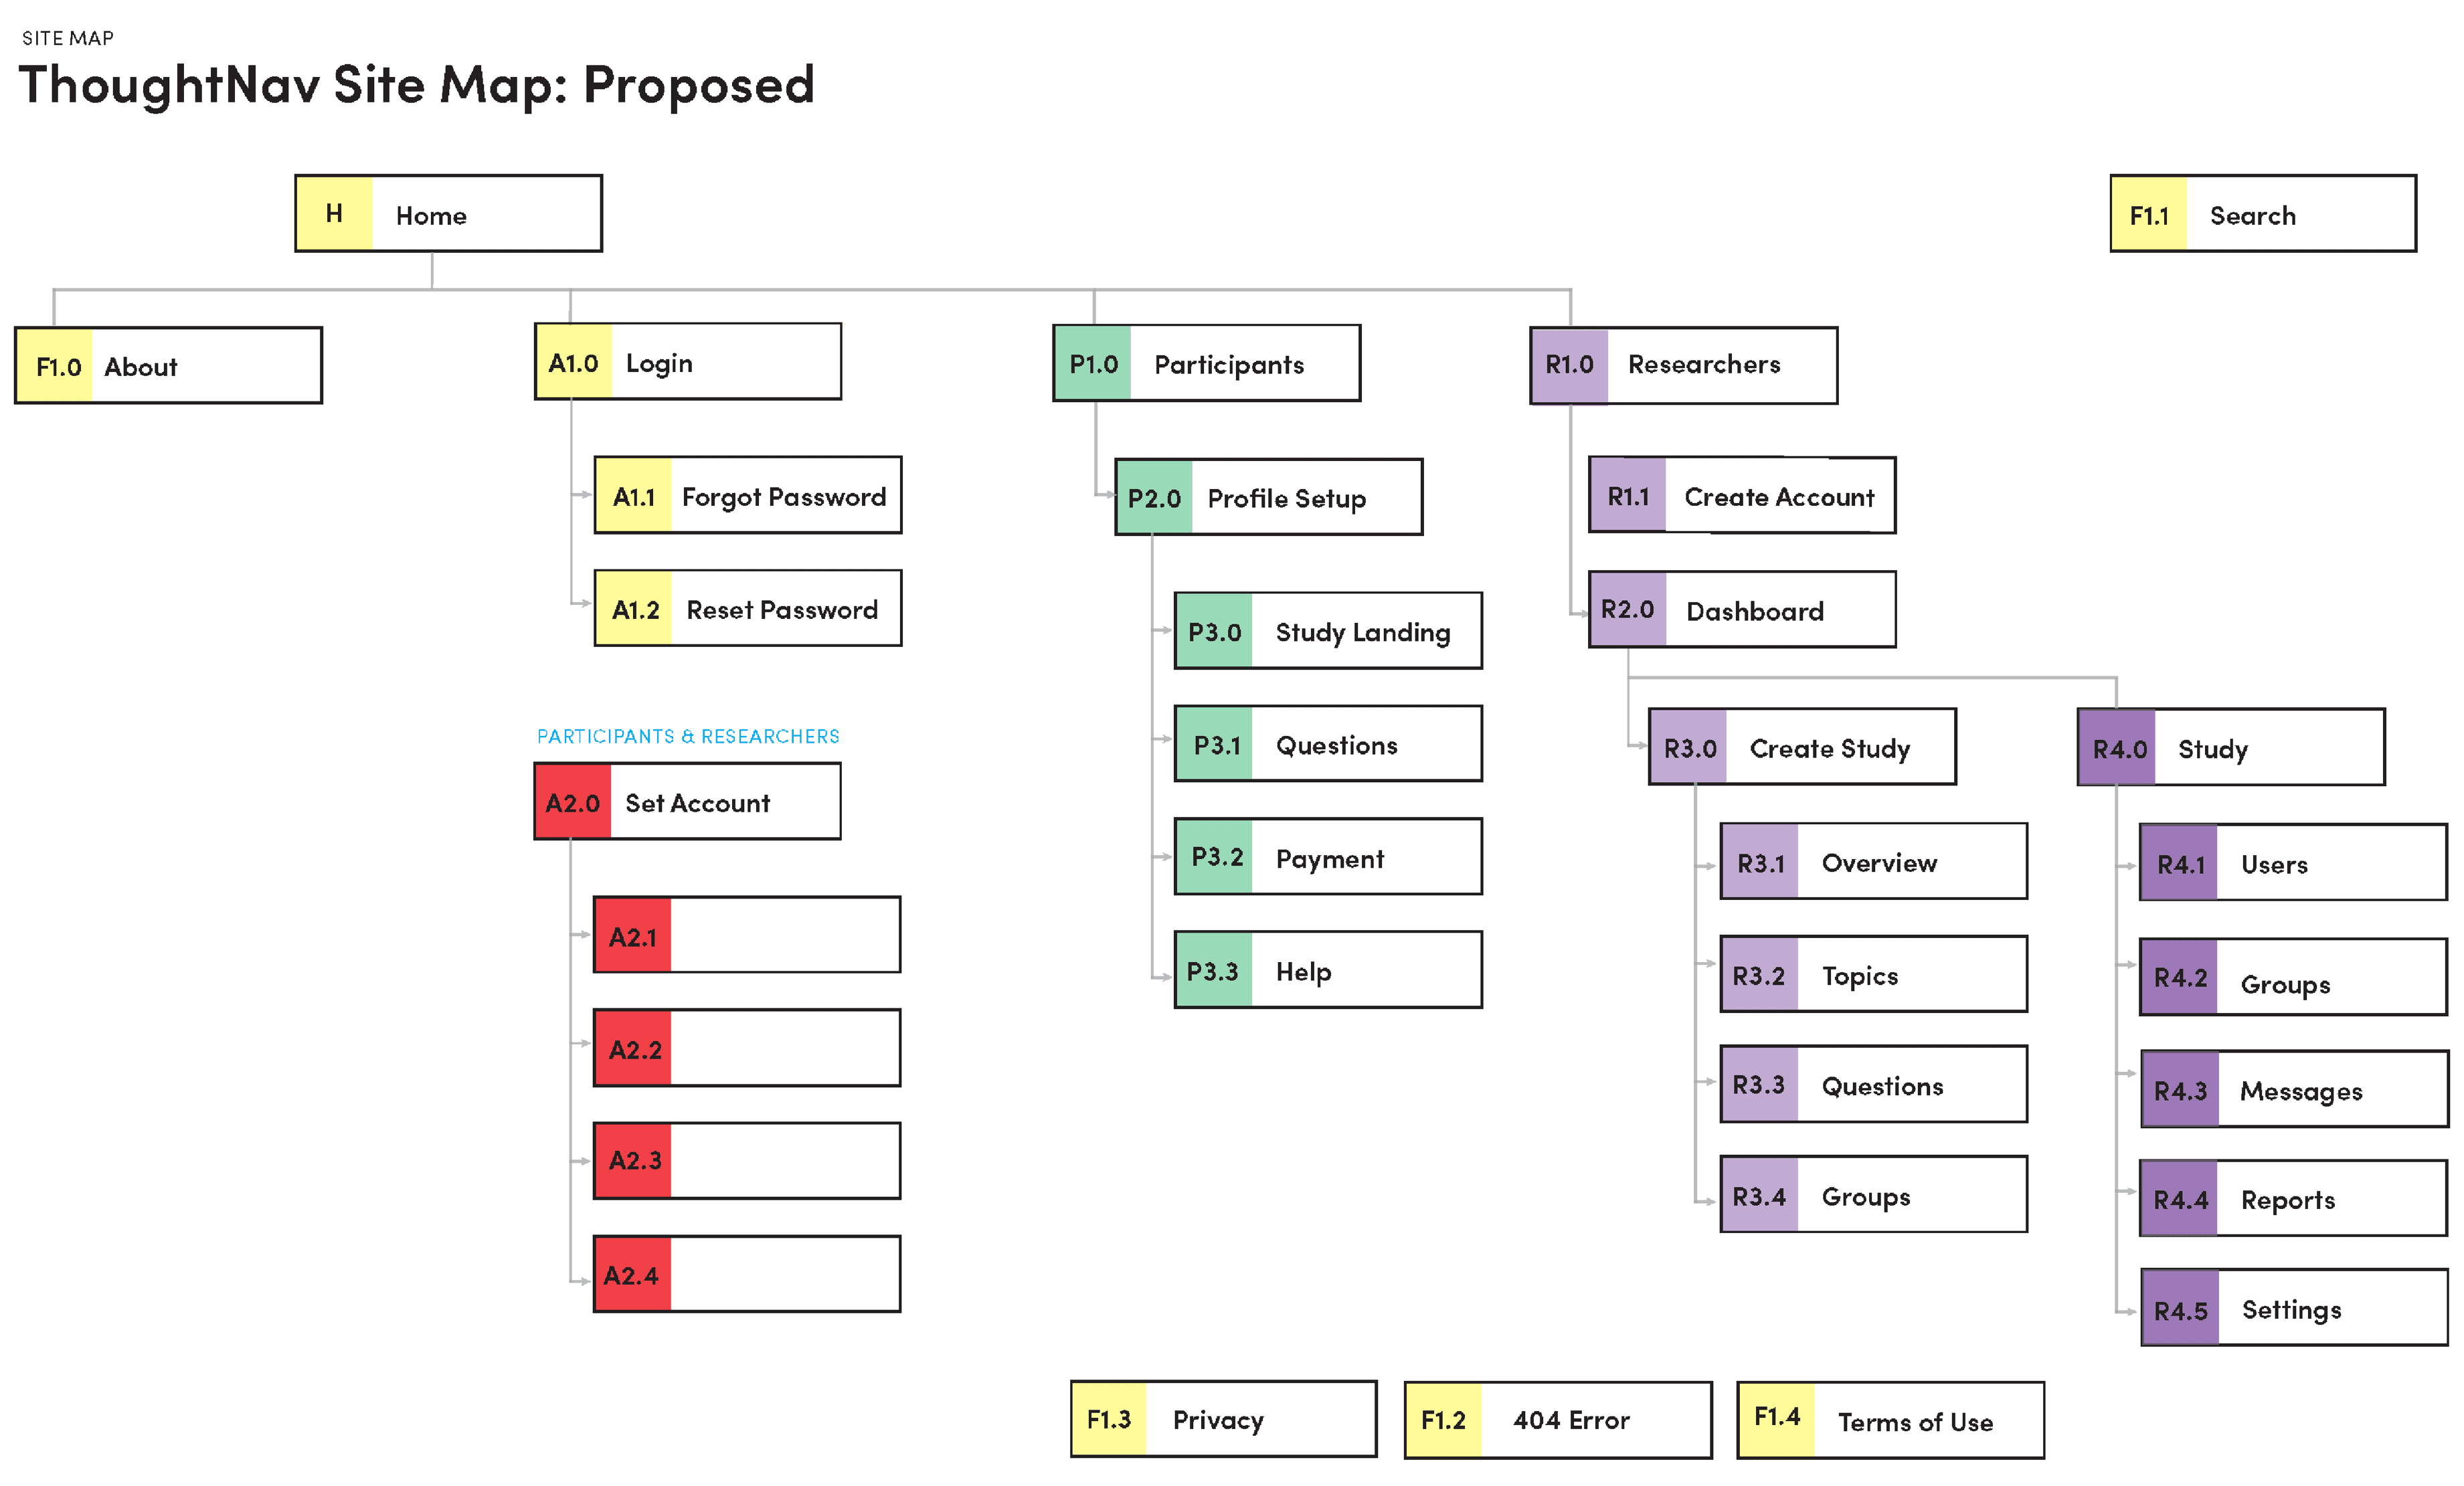
Identifying the user journey was essential for improving the information architecture of the system. The new site map clarified the site experience to its two primary audience members:
Participants
Researchers
Participants receive an invitation and have a simplified experience throughout the site, landing them in the study as quickly as possible.
Researchers now have the ability to create a new account, create multiple studies, moderate studies, and export reports.
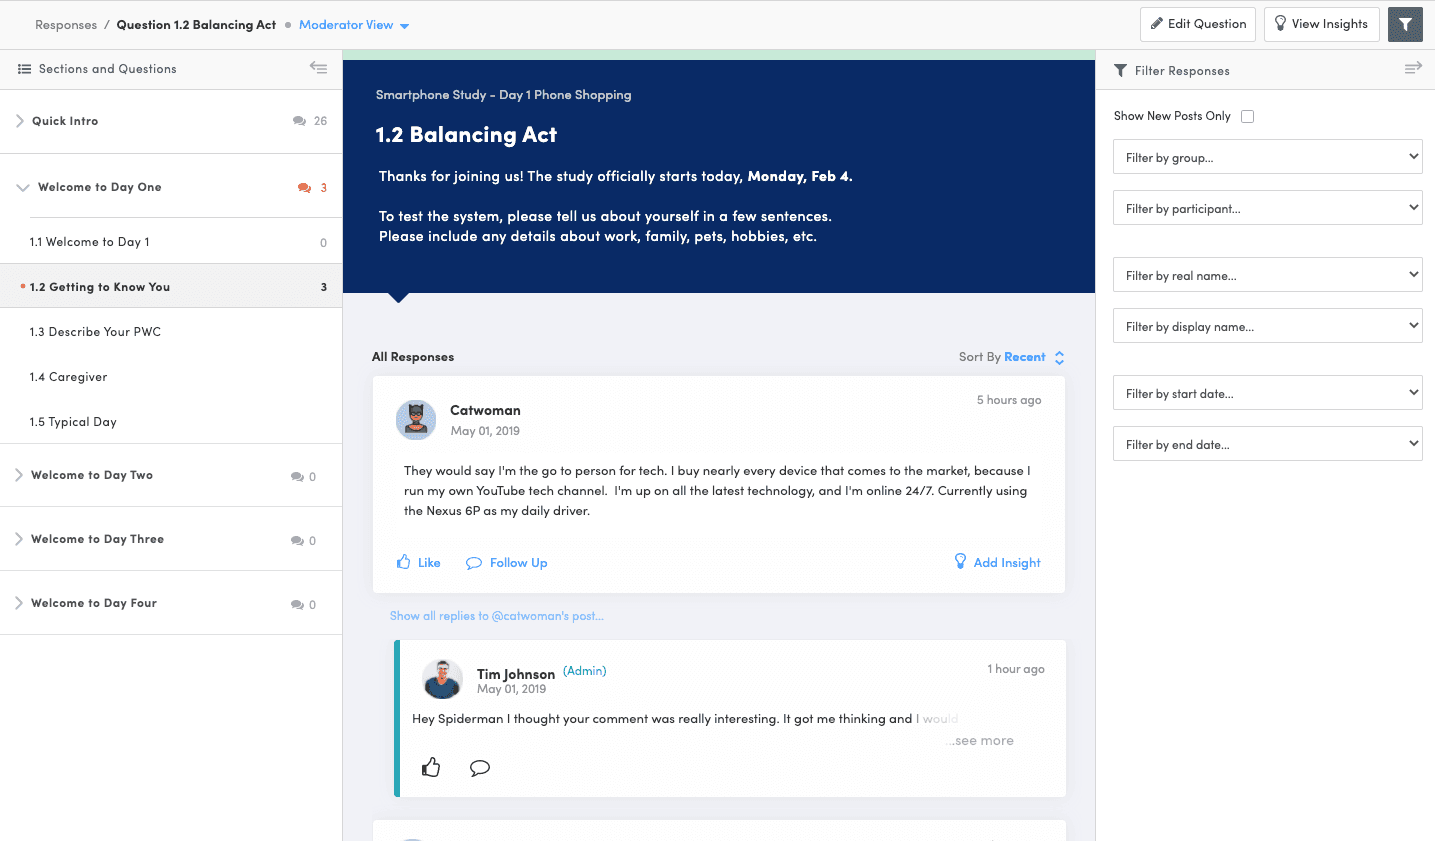
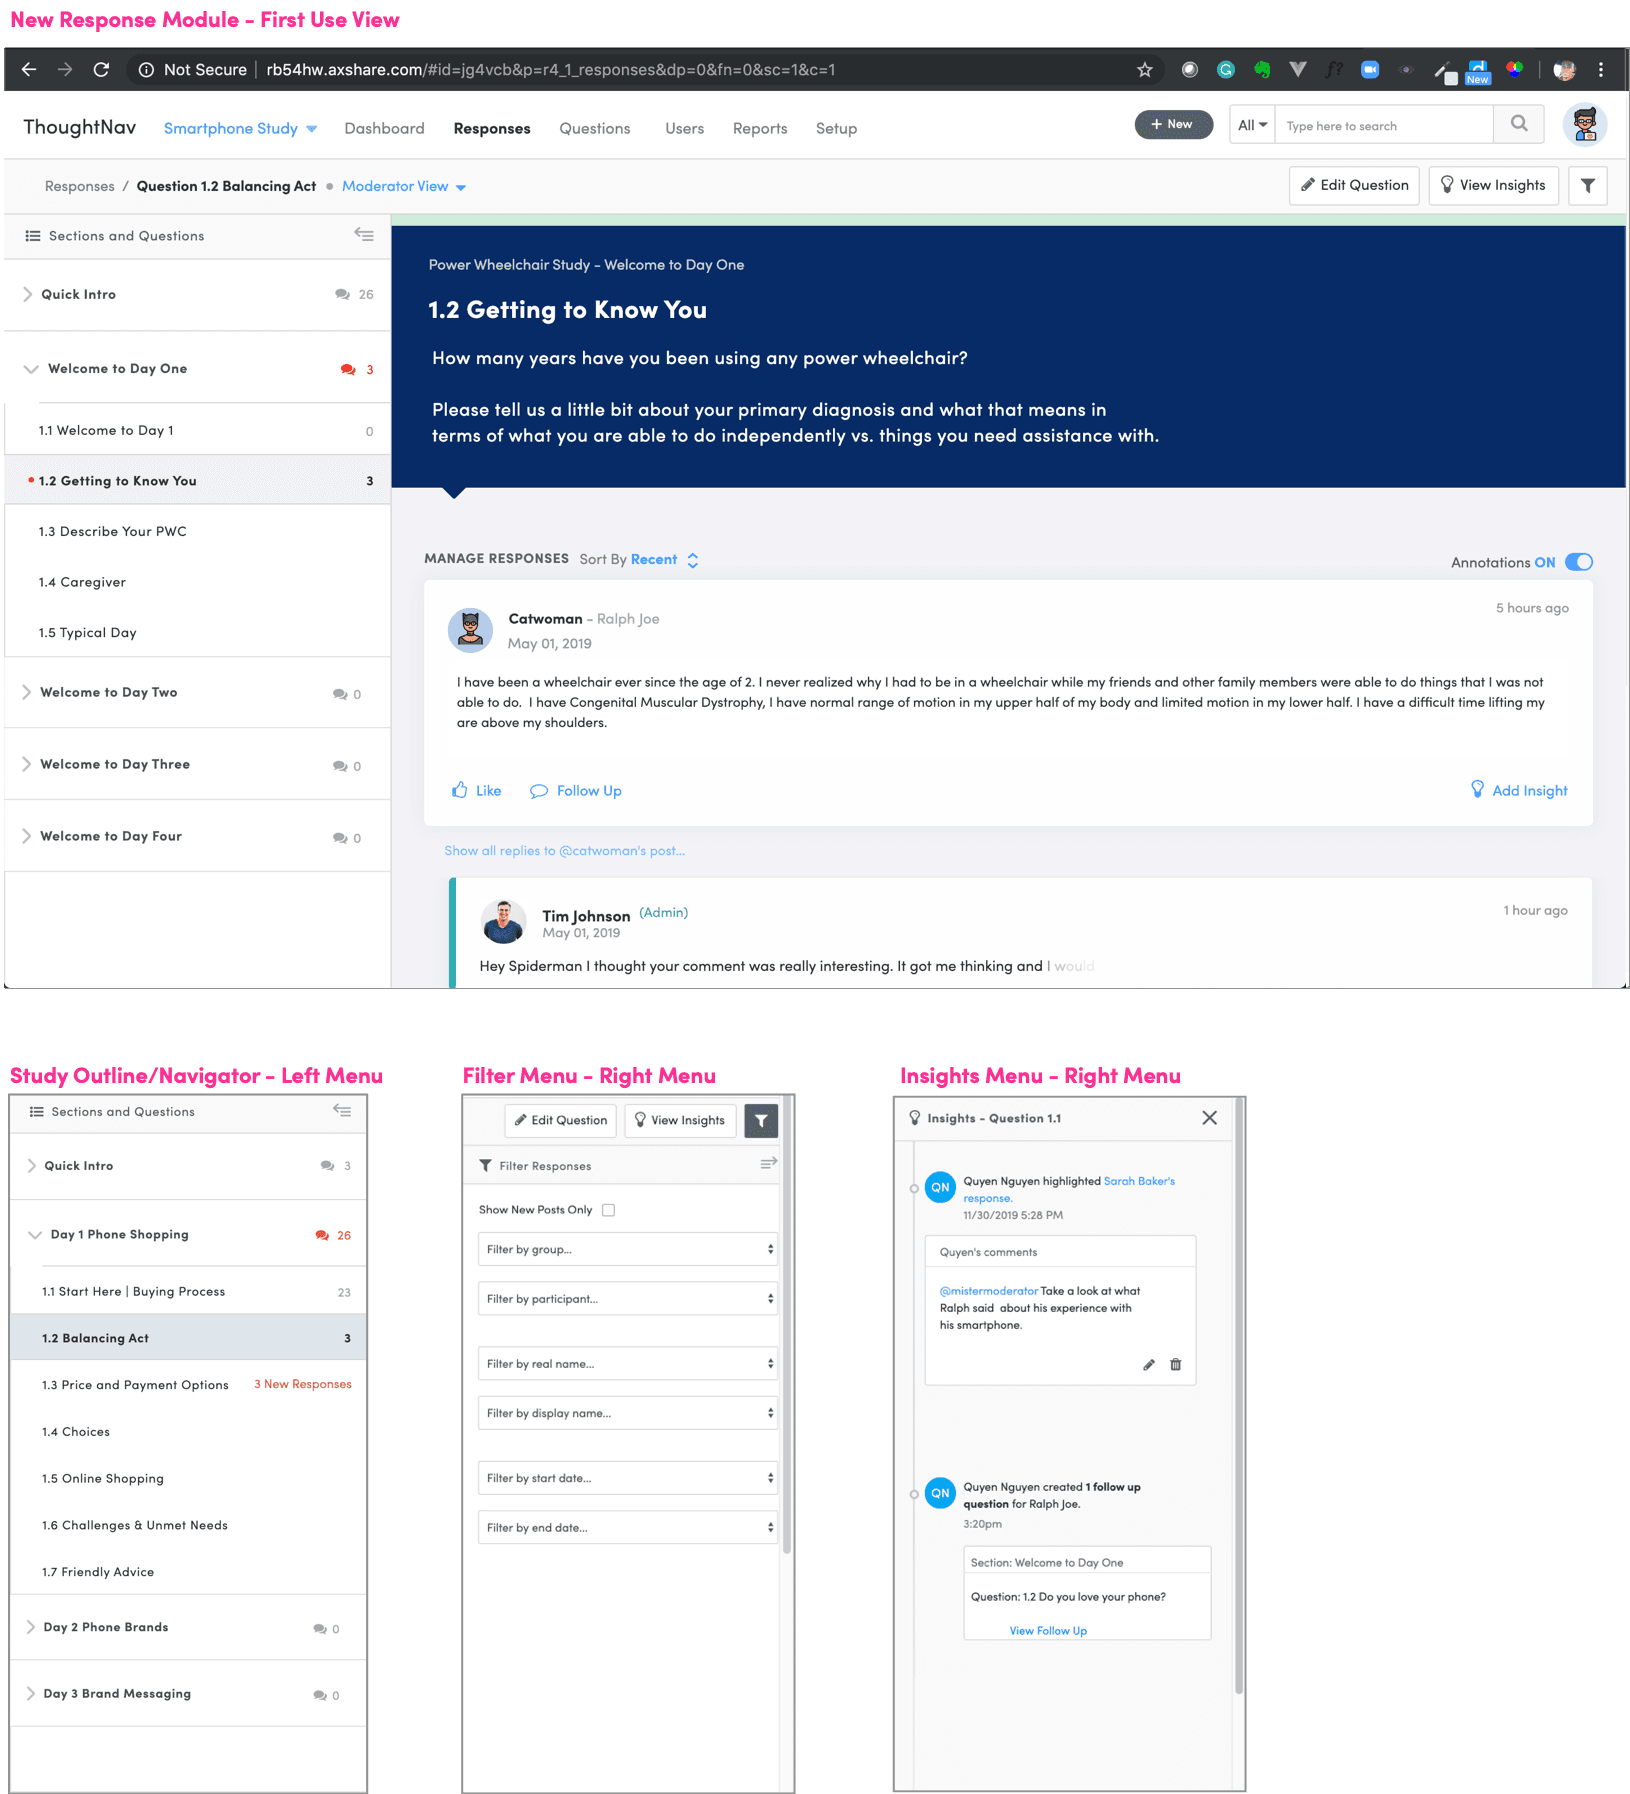
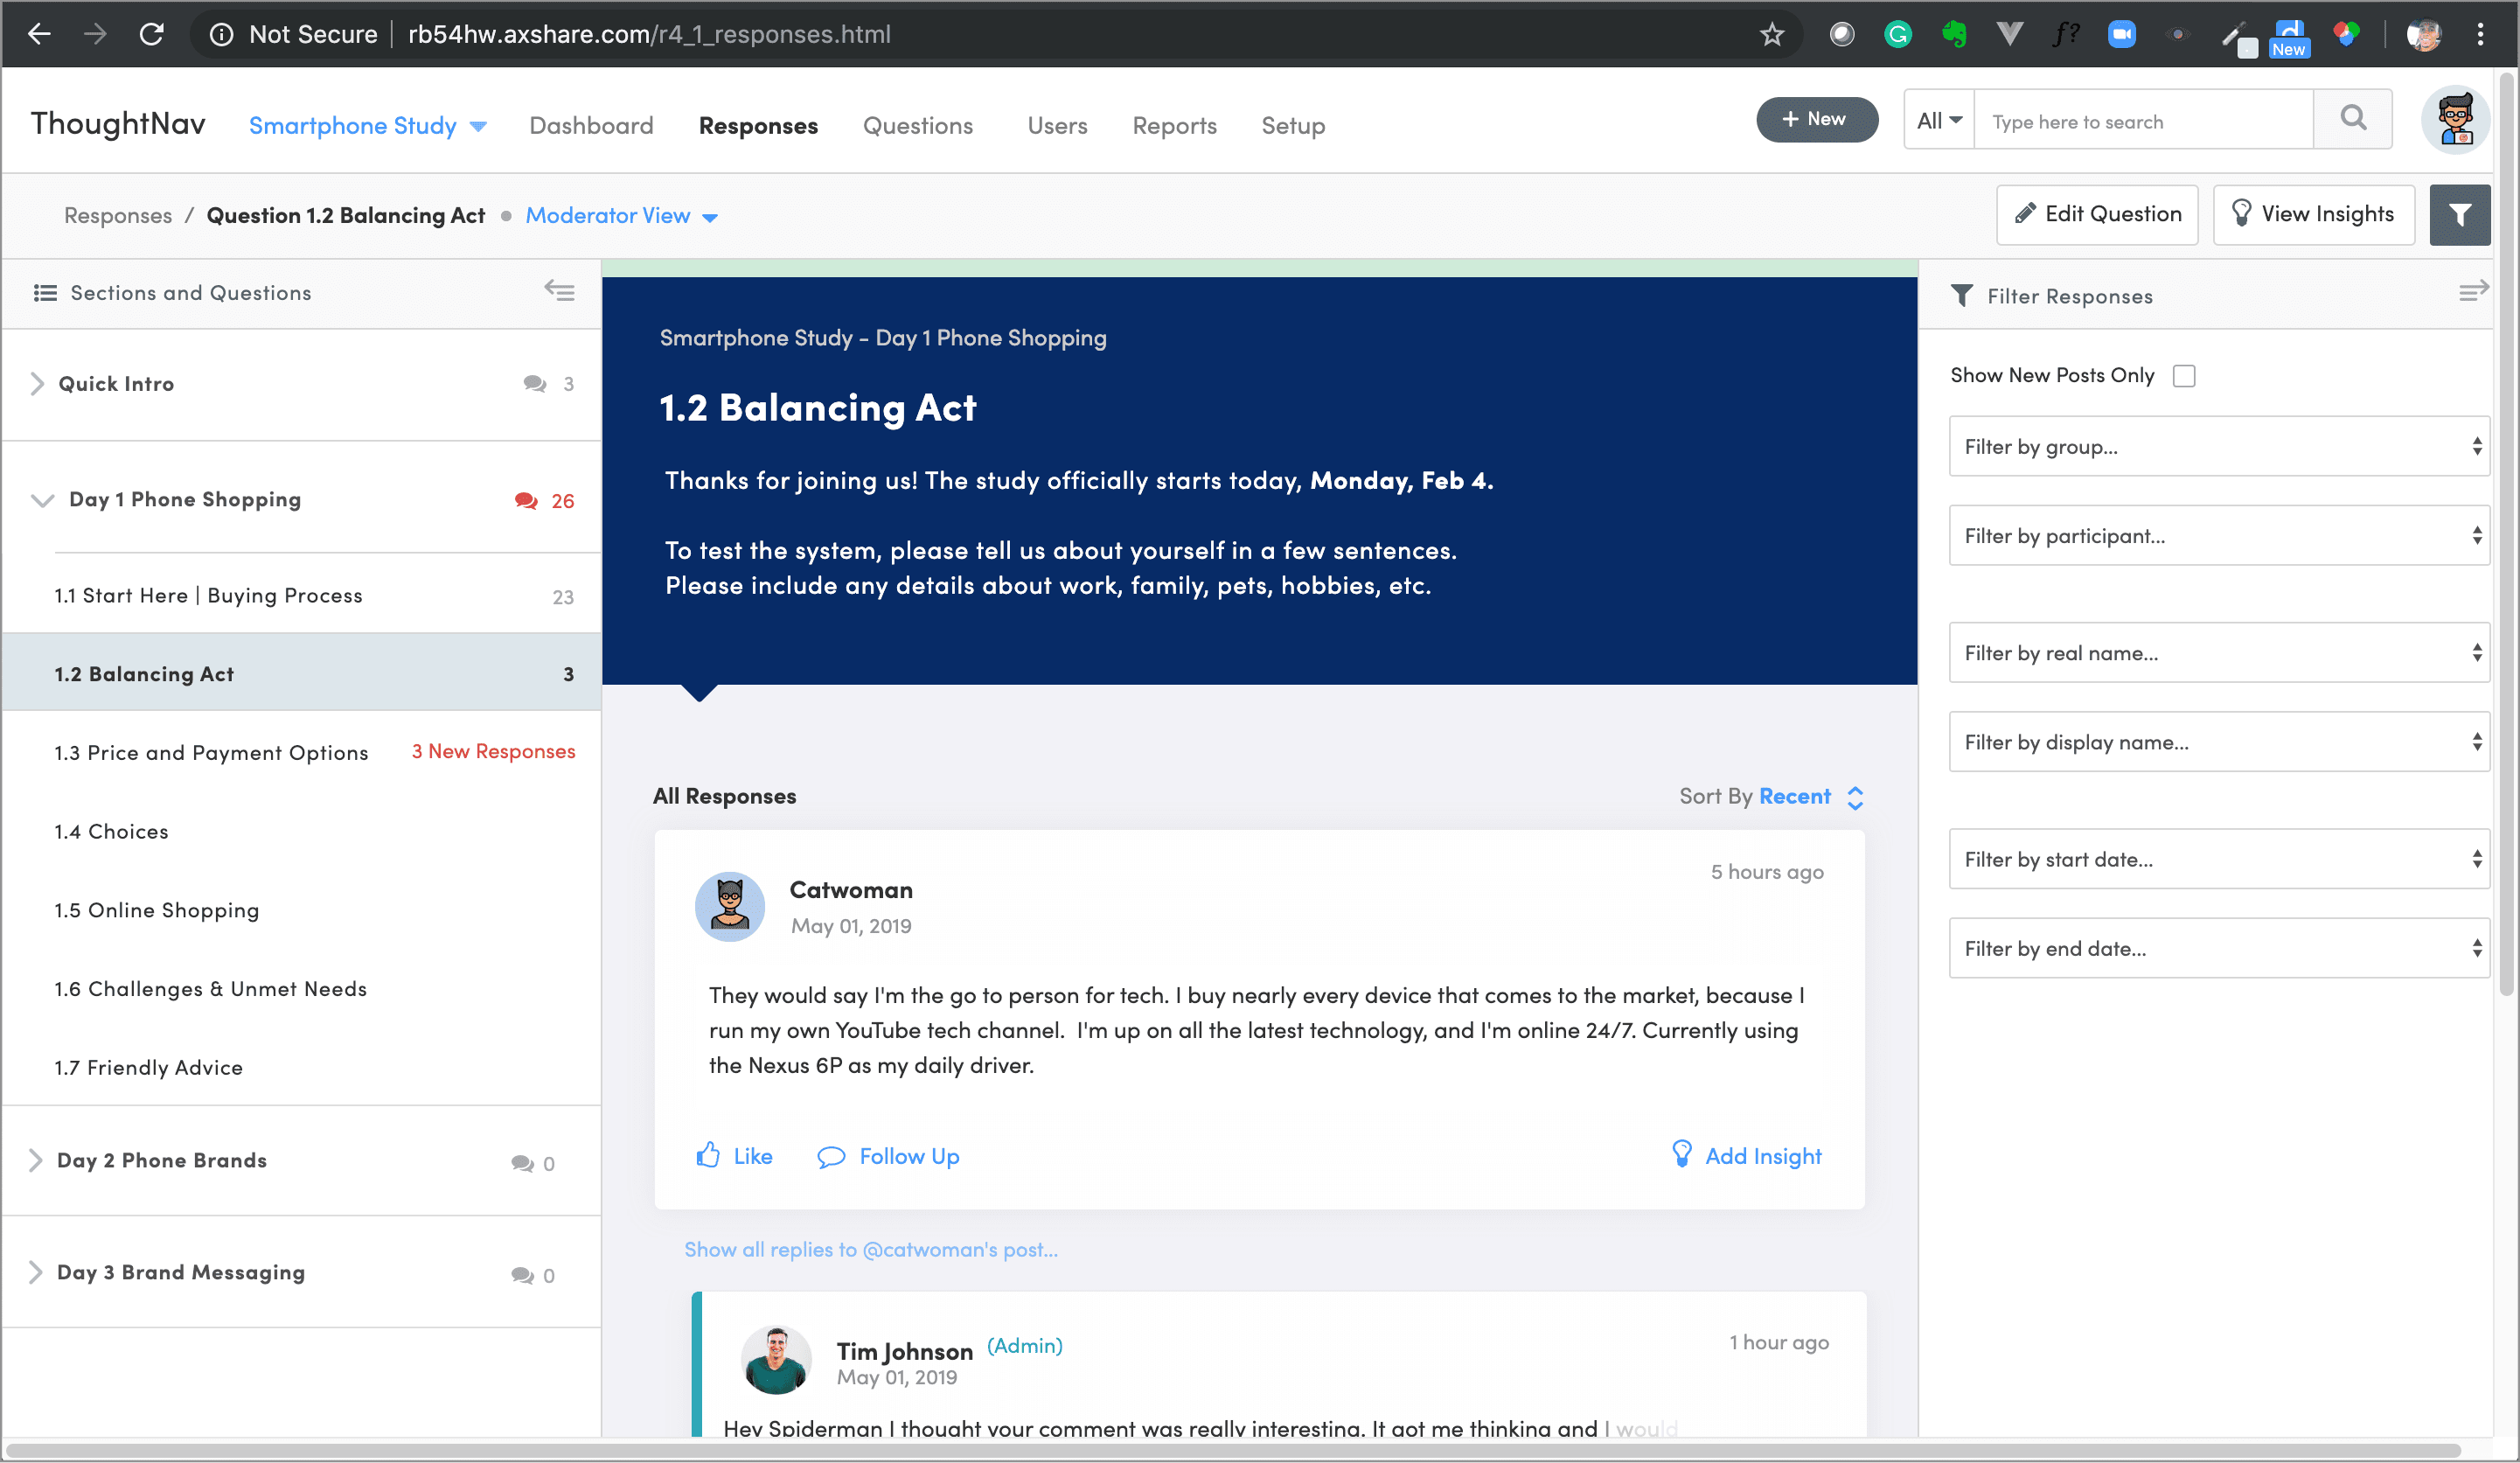
The new system has addressed Aperio’s needs by providing three new collapsible menus within the redesigned response module:
The Sections and Questions menu enables quick navigation between participant responses, while also allowing researchers to hide the menu to focus solely on study content.
A Filter menu was added to reduce the information on-screen and direct researchers to their desired participant responses. Multiple parameters/fields can be adjusted to modify the search results.
An Insight menu was added to enable researchers to annotate responses and store their commentary within the system. Researchers now have the ability to highlight a specific segment of a response and attach a note that is saved as an insight. Insights can be shared amongst all researchers acting as moderators within the same study to promote remote collaboration and a shared repository of data.
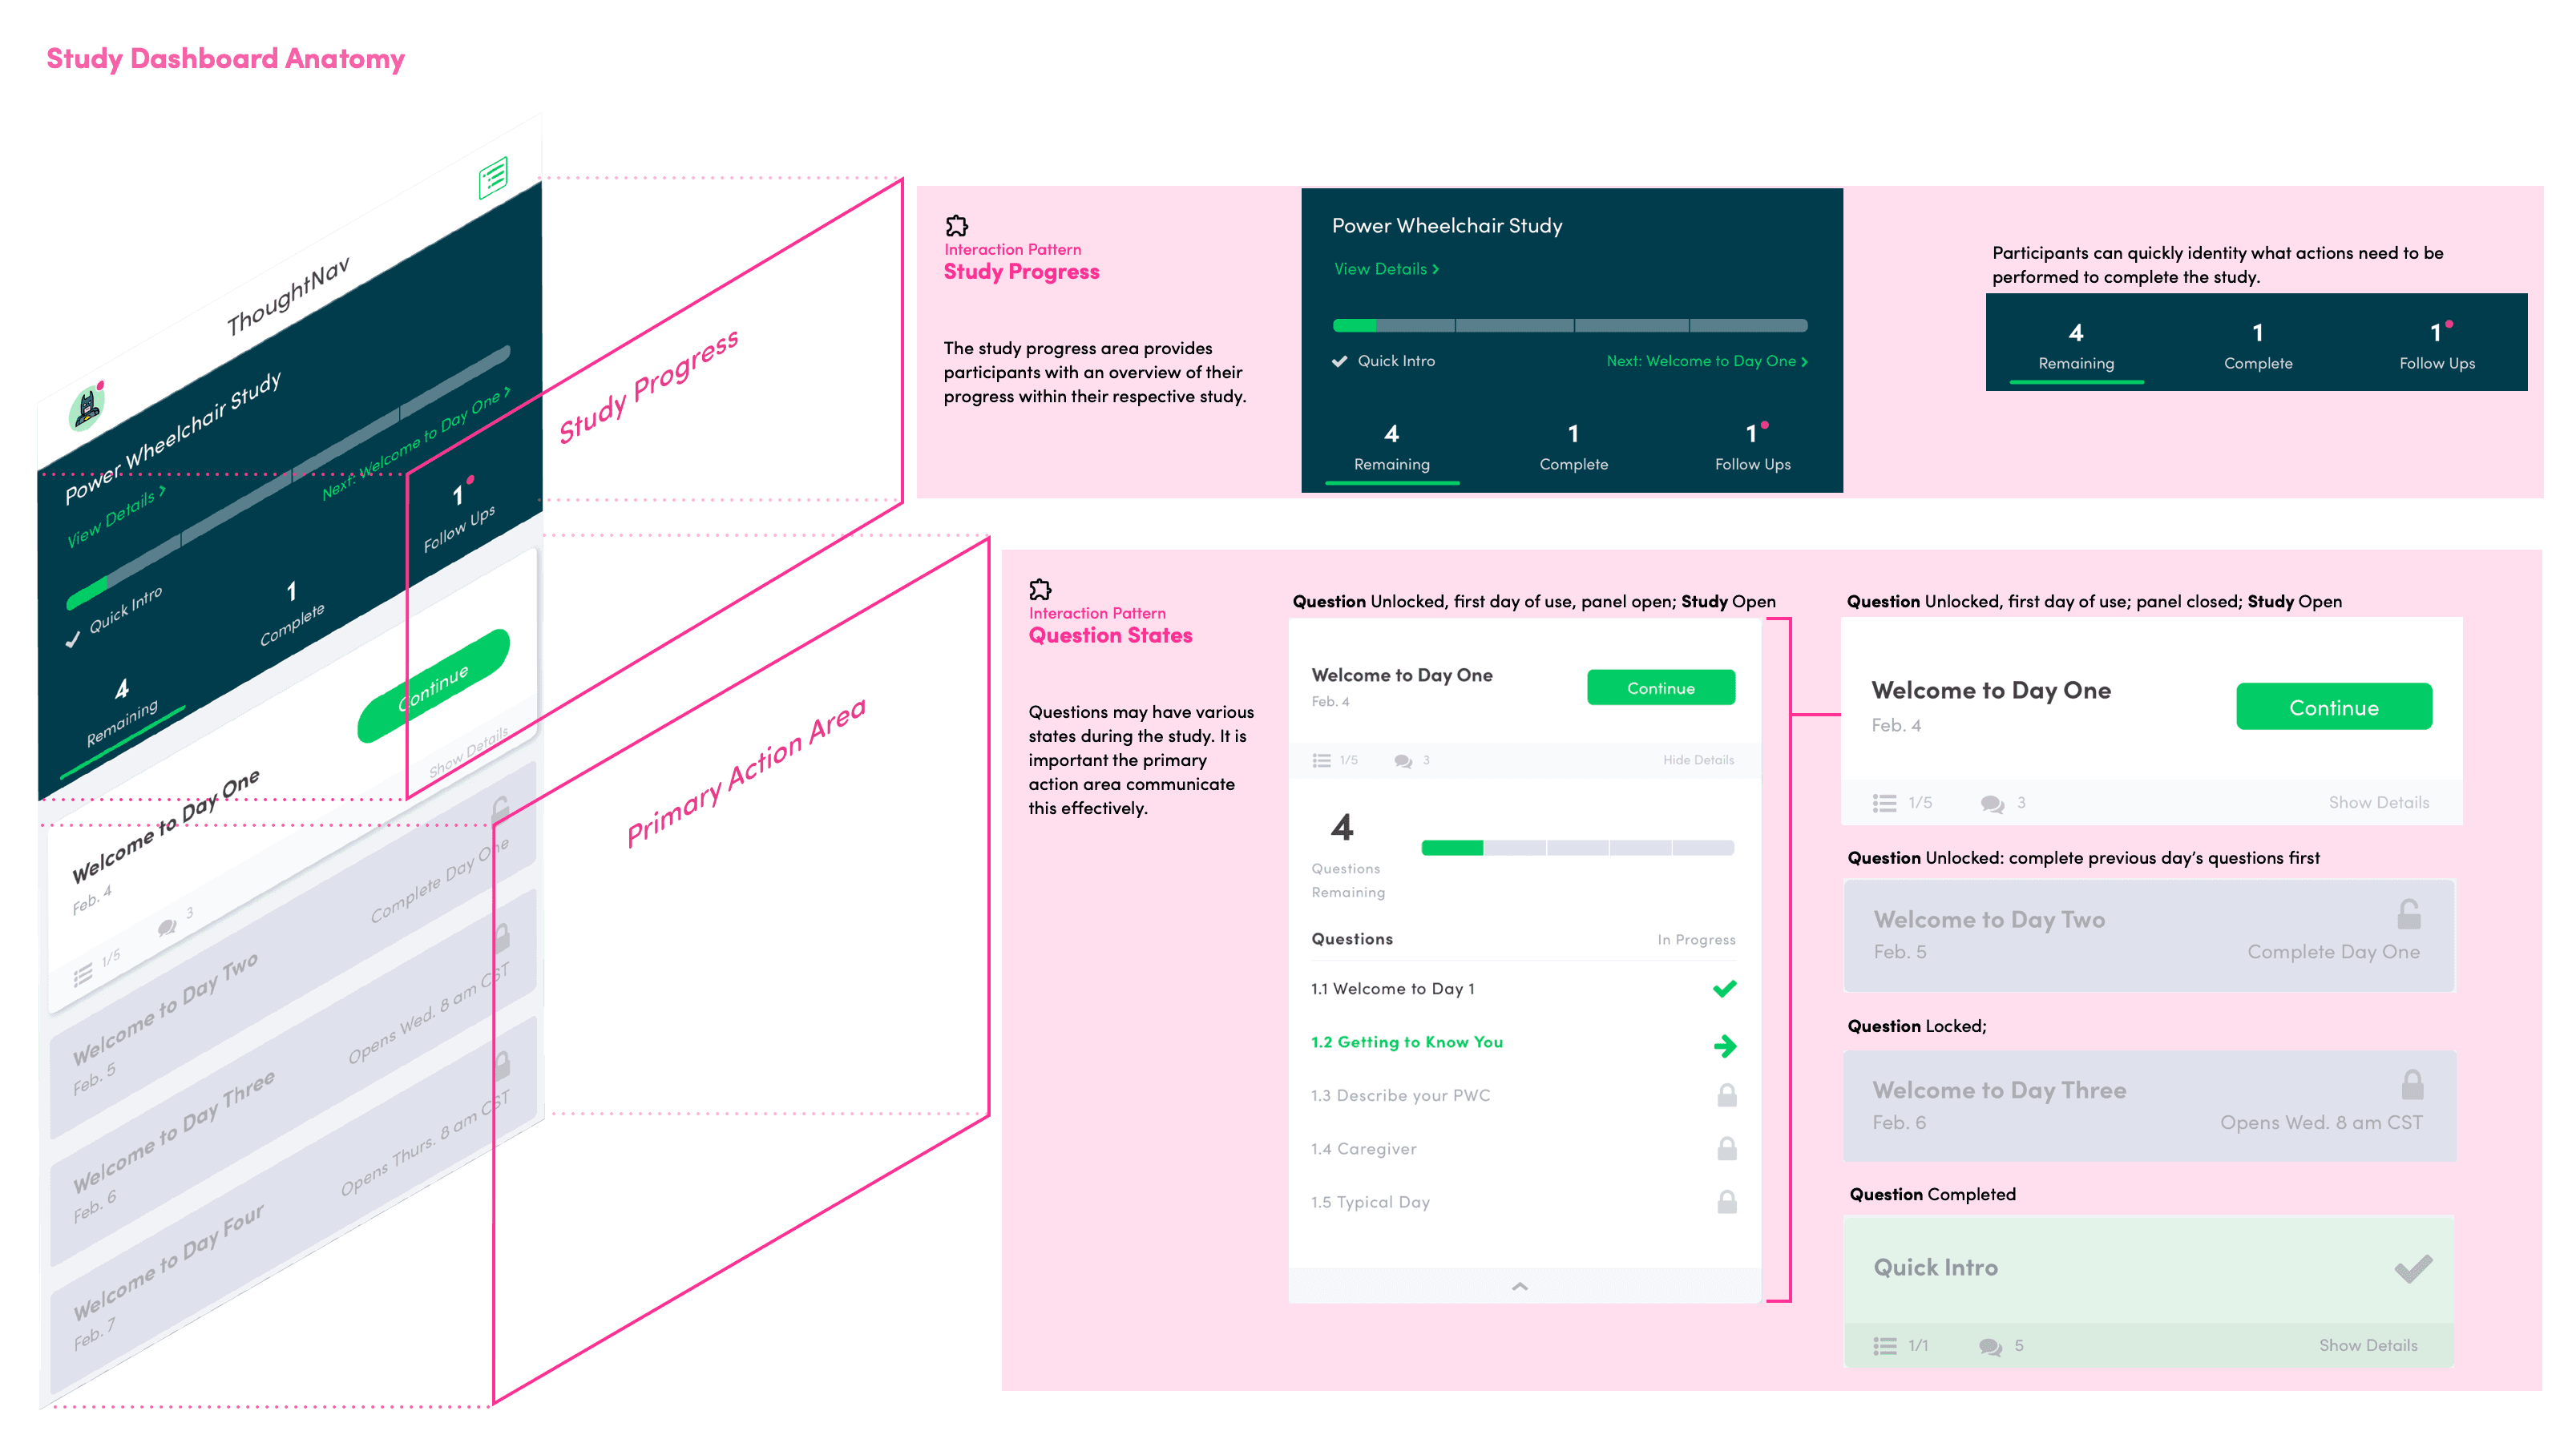
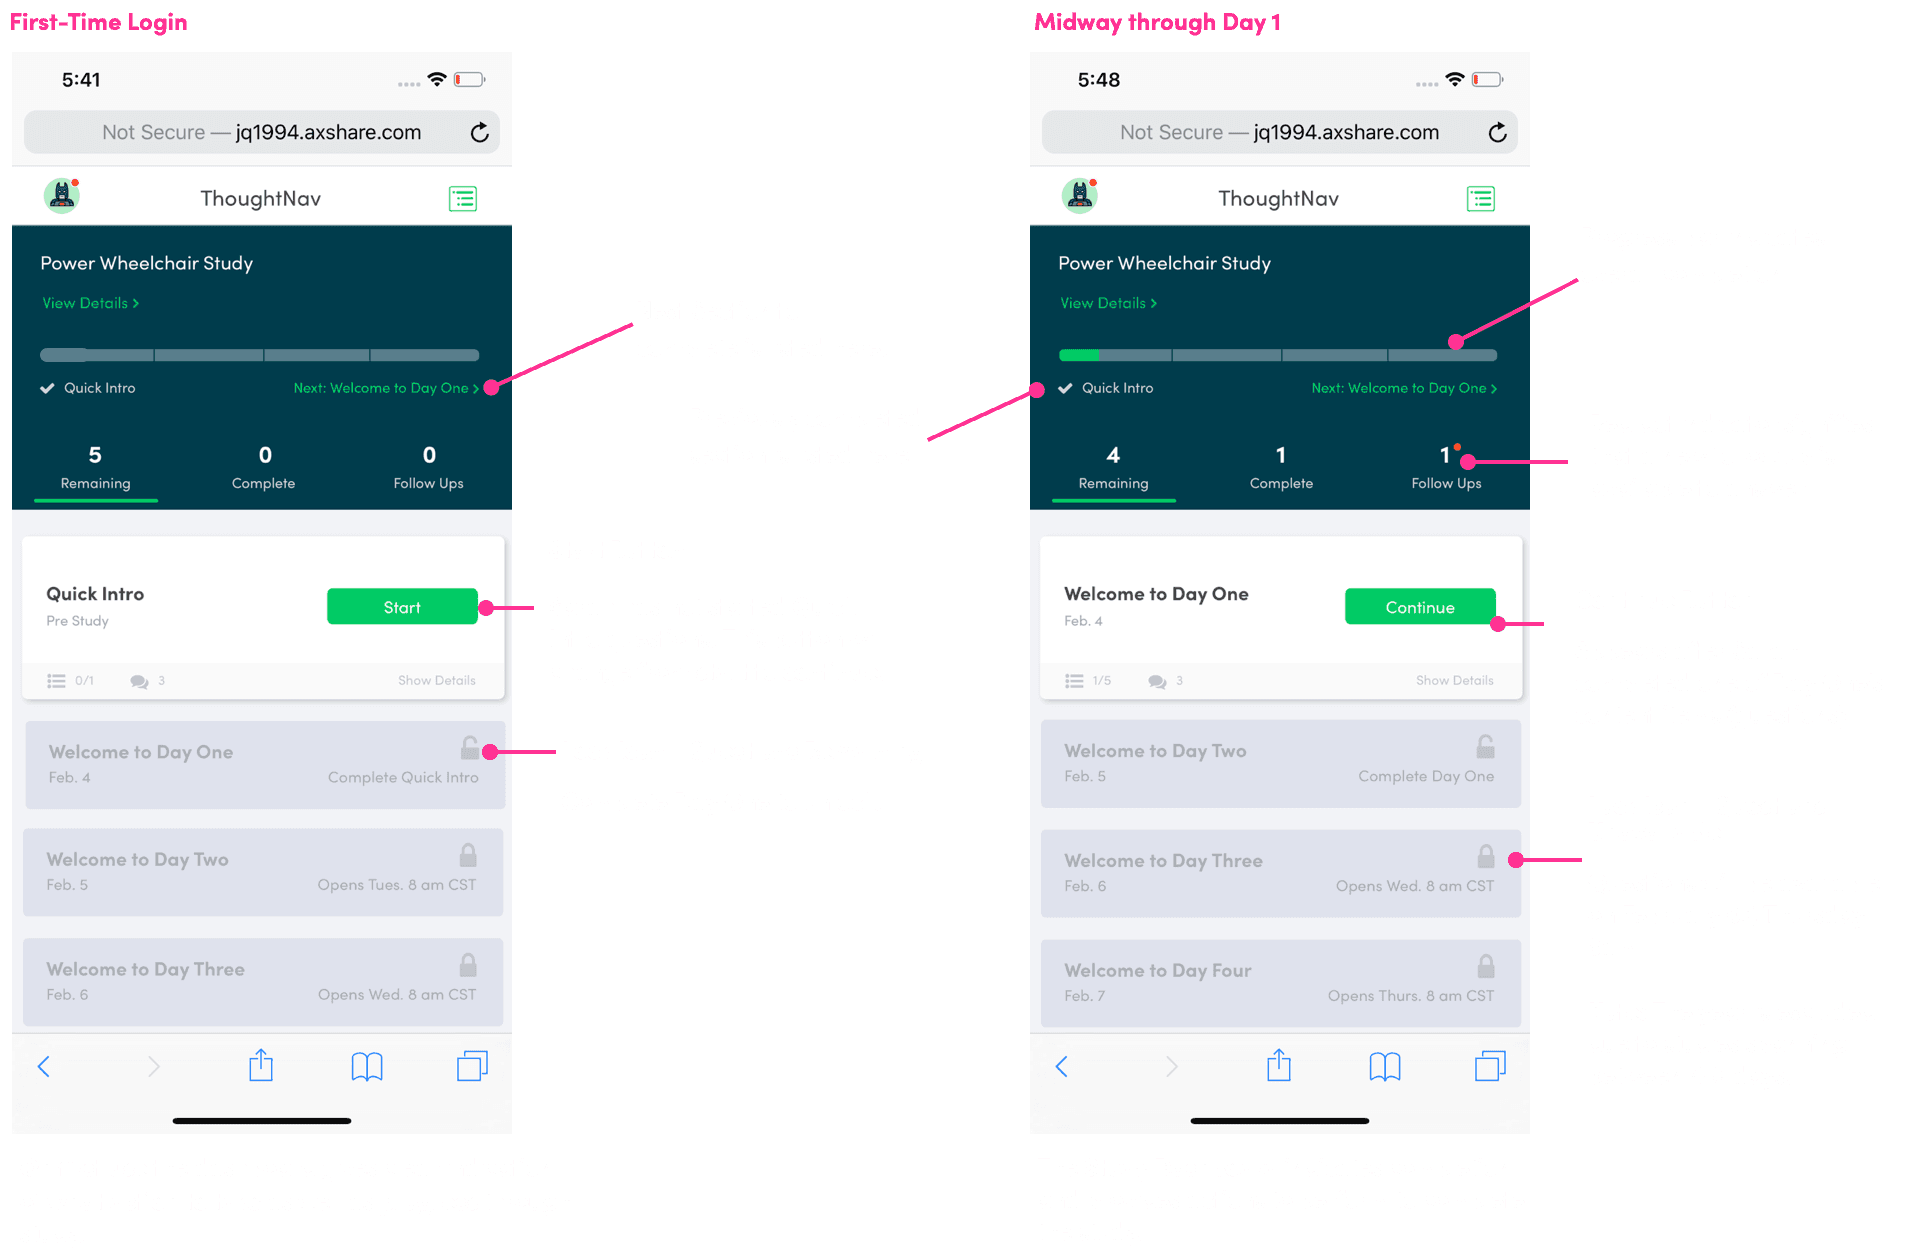
Outside of answering study questions, participants will spend the most time on the study dashboard.
The dashboard appears after logging in. It is important that the dashboard conveys progress and directs each participant to any remaining questions that need to be completed.
A participant's primary goal is to complete all questions within each section of their respective study, and claim a reward after successfully doing so.
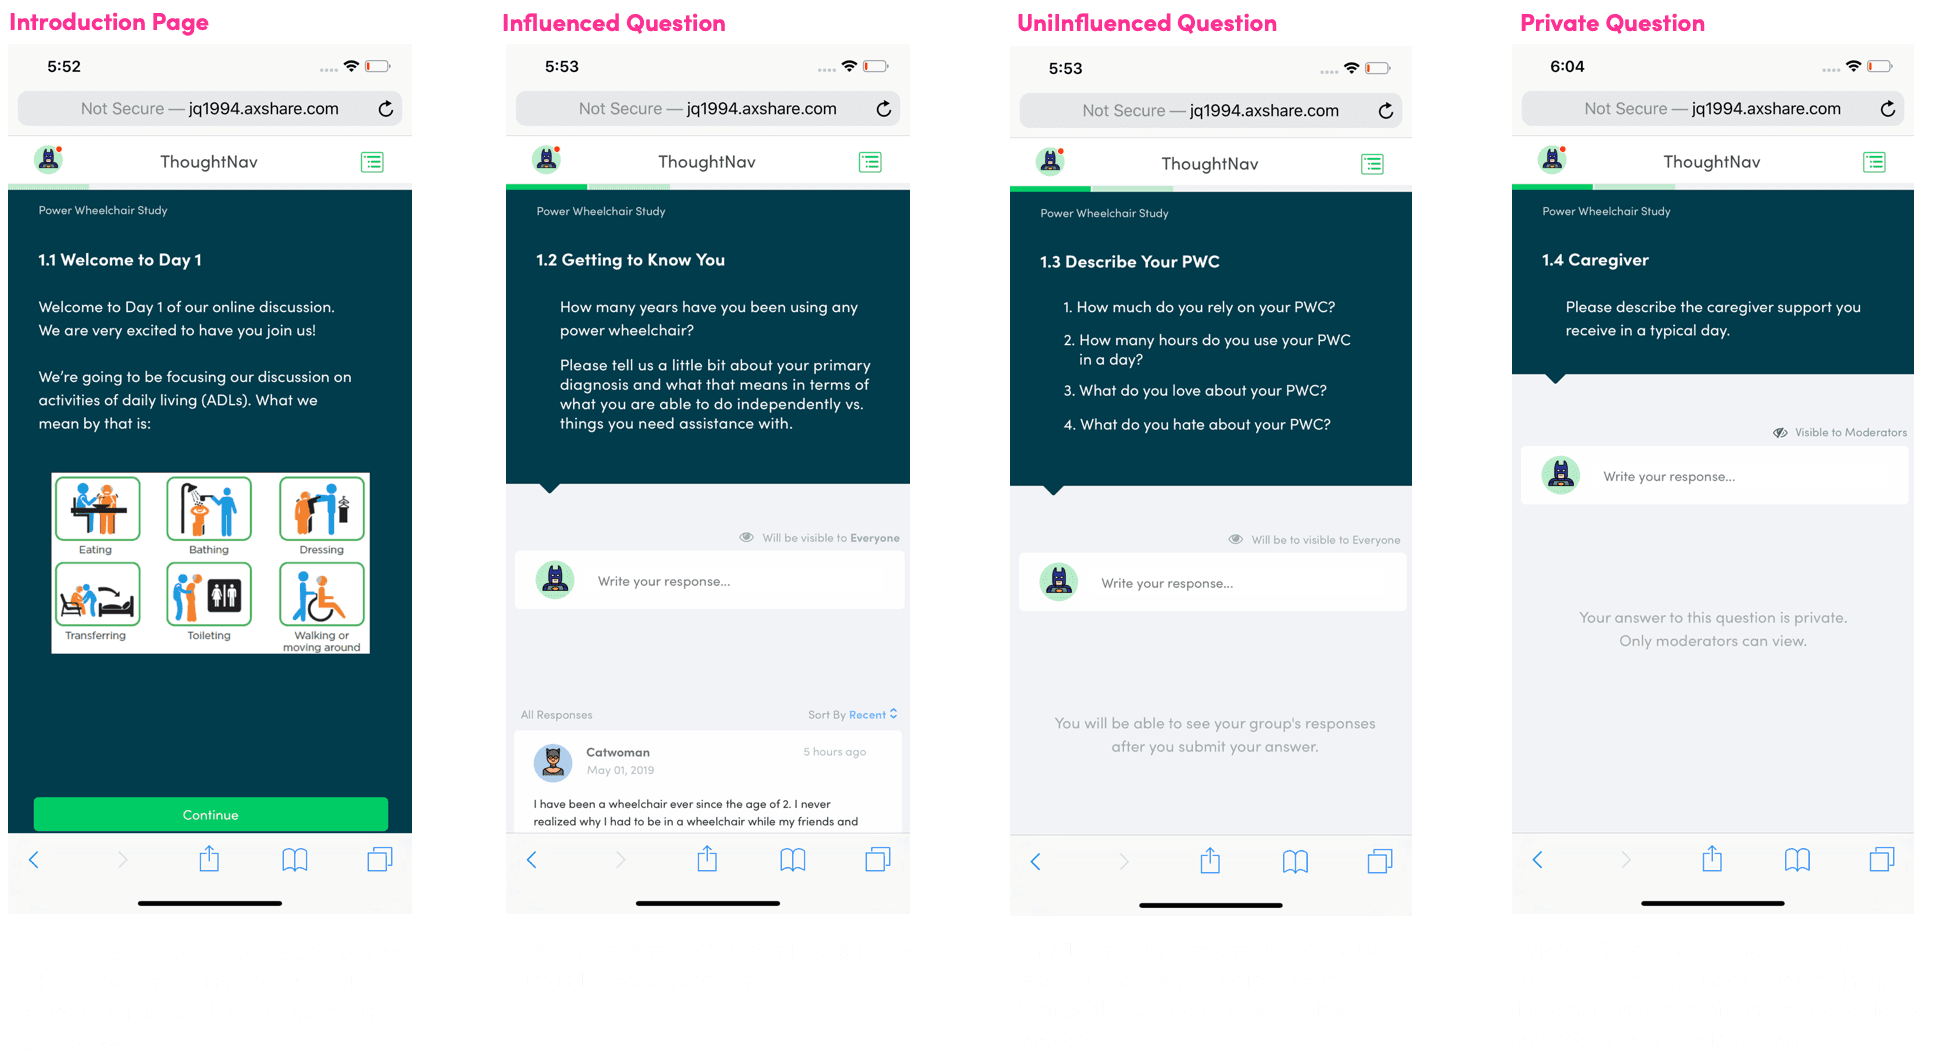
There are 4 different page types to consider for the redesigned question module:
Introduction - The intro page type is best utilized as the lead page for new study sections.
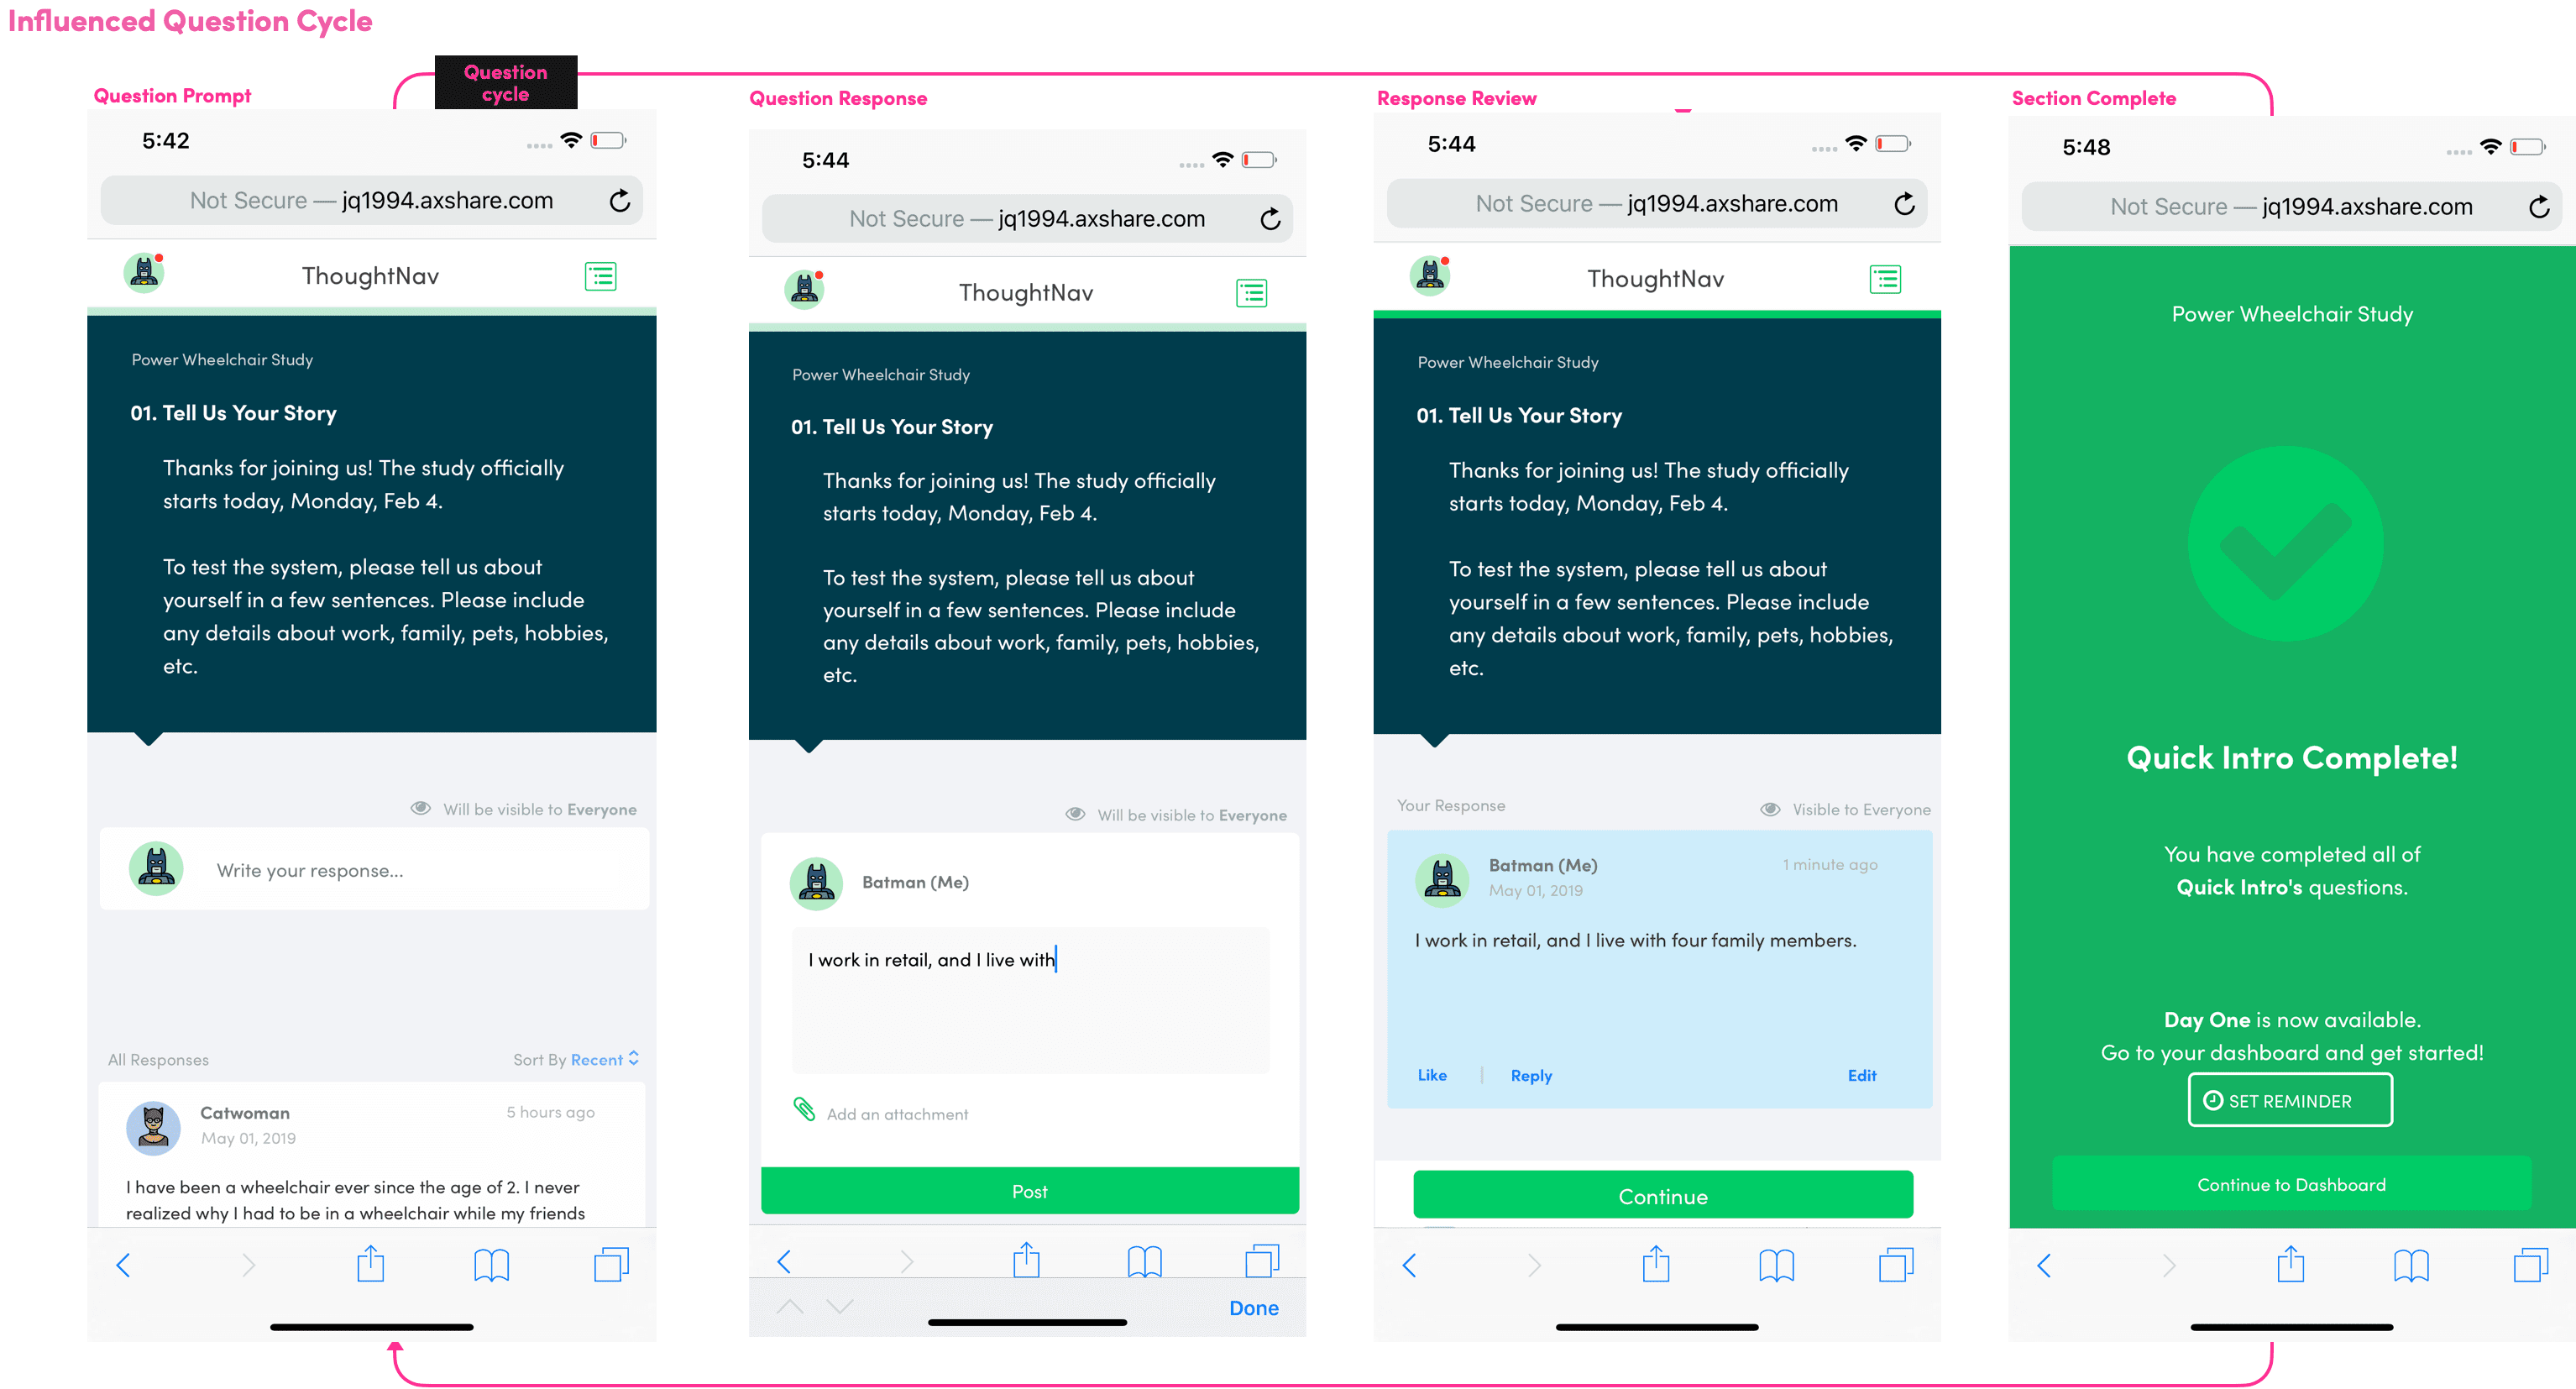
Influenced - The majority of questions created by Aperio Insights are influenced questions. Participants have the ability to view all previous responses before submitting their own response.
Uninfluenced - Responses will be visible by all participants, and moderators with access to the specific question that was answered. Participants can view previous responses only after submitting a post.
Private - Responses to private questions are only visible by the participant that posted the question, and any moderator's who have access to view the question.
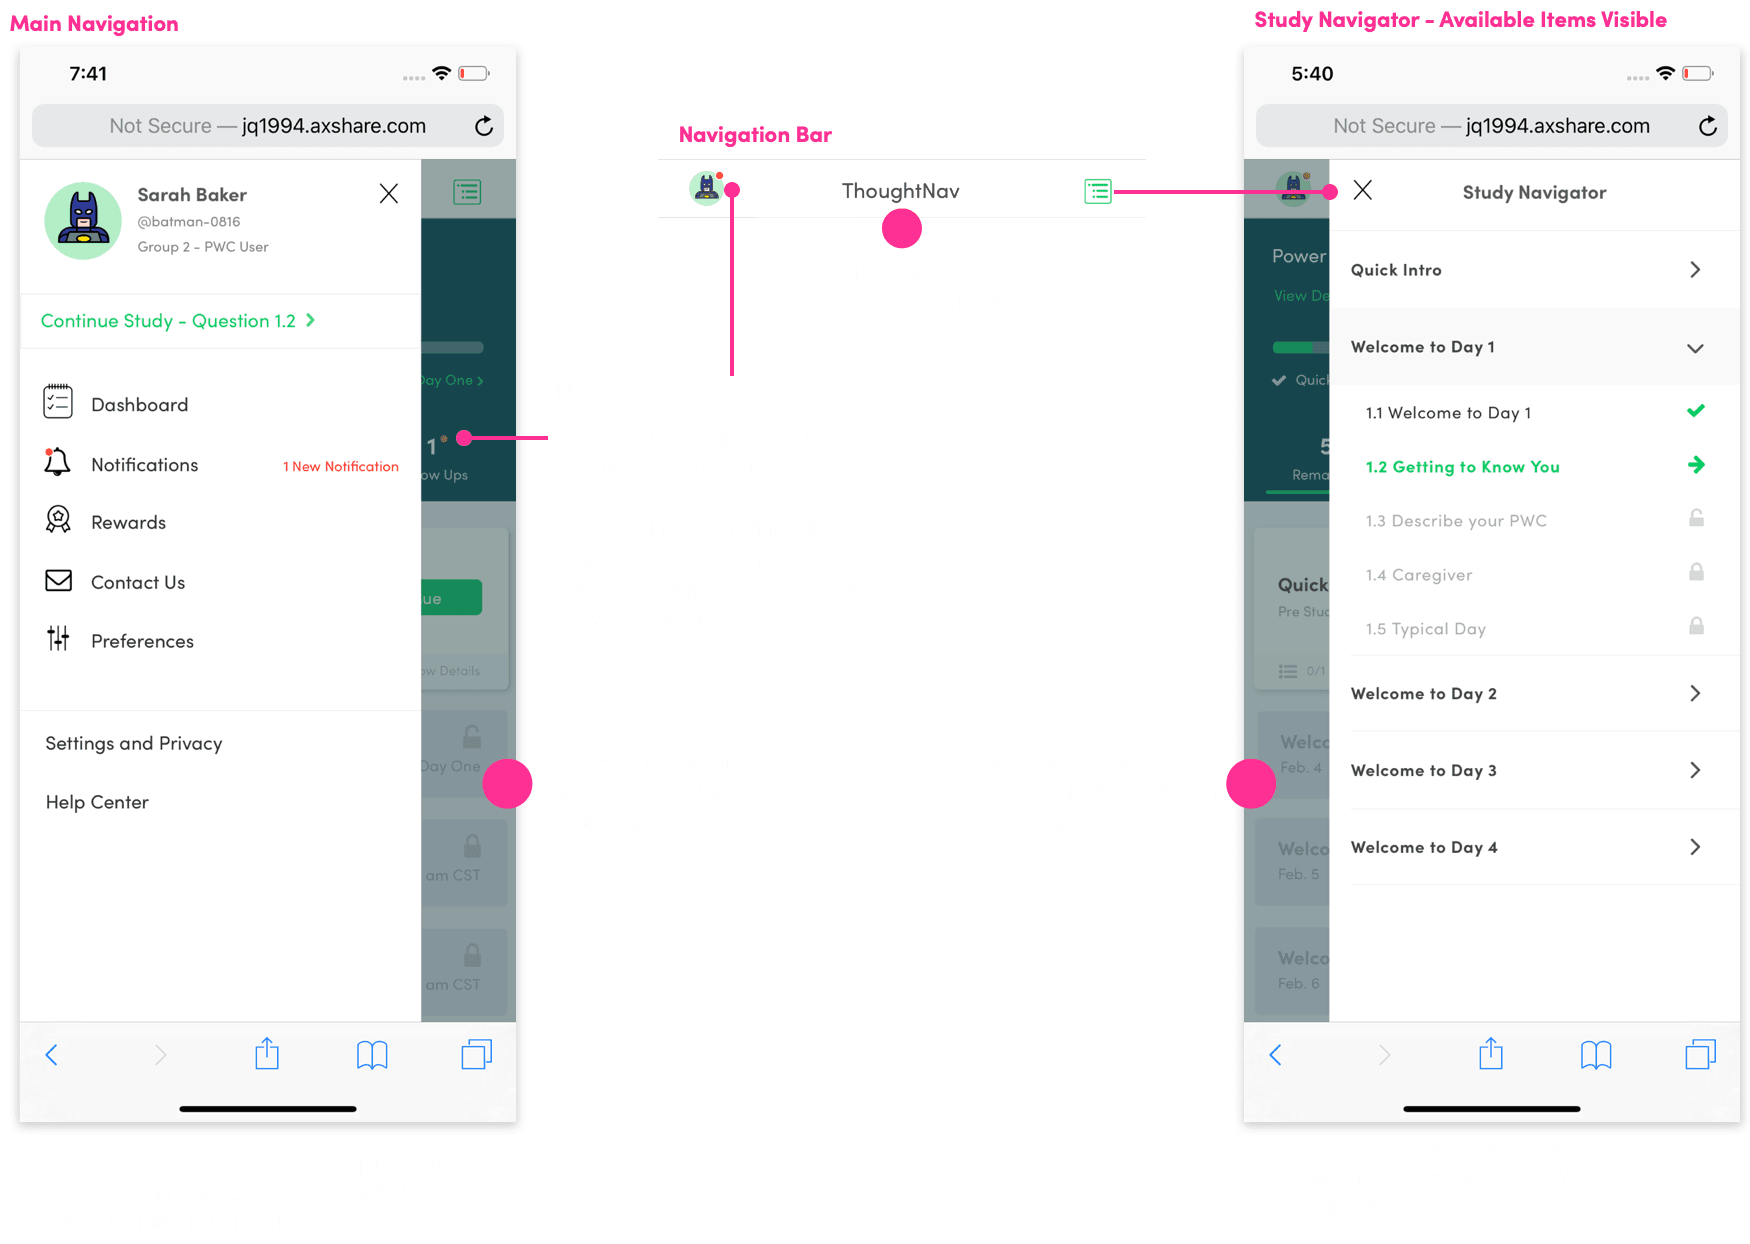
Global Navigation enables participants to access different areas of the system. It is important that participants have access to the global navigation at all times throughout the study.
The Study Navigator provides an outline of the study's content and allows participants to navigate the study quickly by displaying questions that will be asked later on.
As another form of “progress bar” participants should feel a sense of accomplishment when they interact with the navigator.
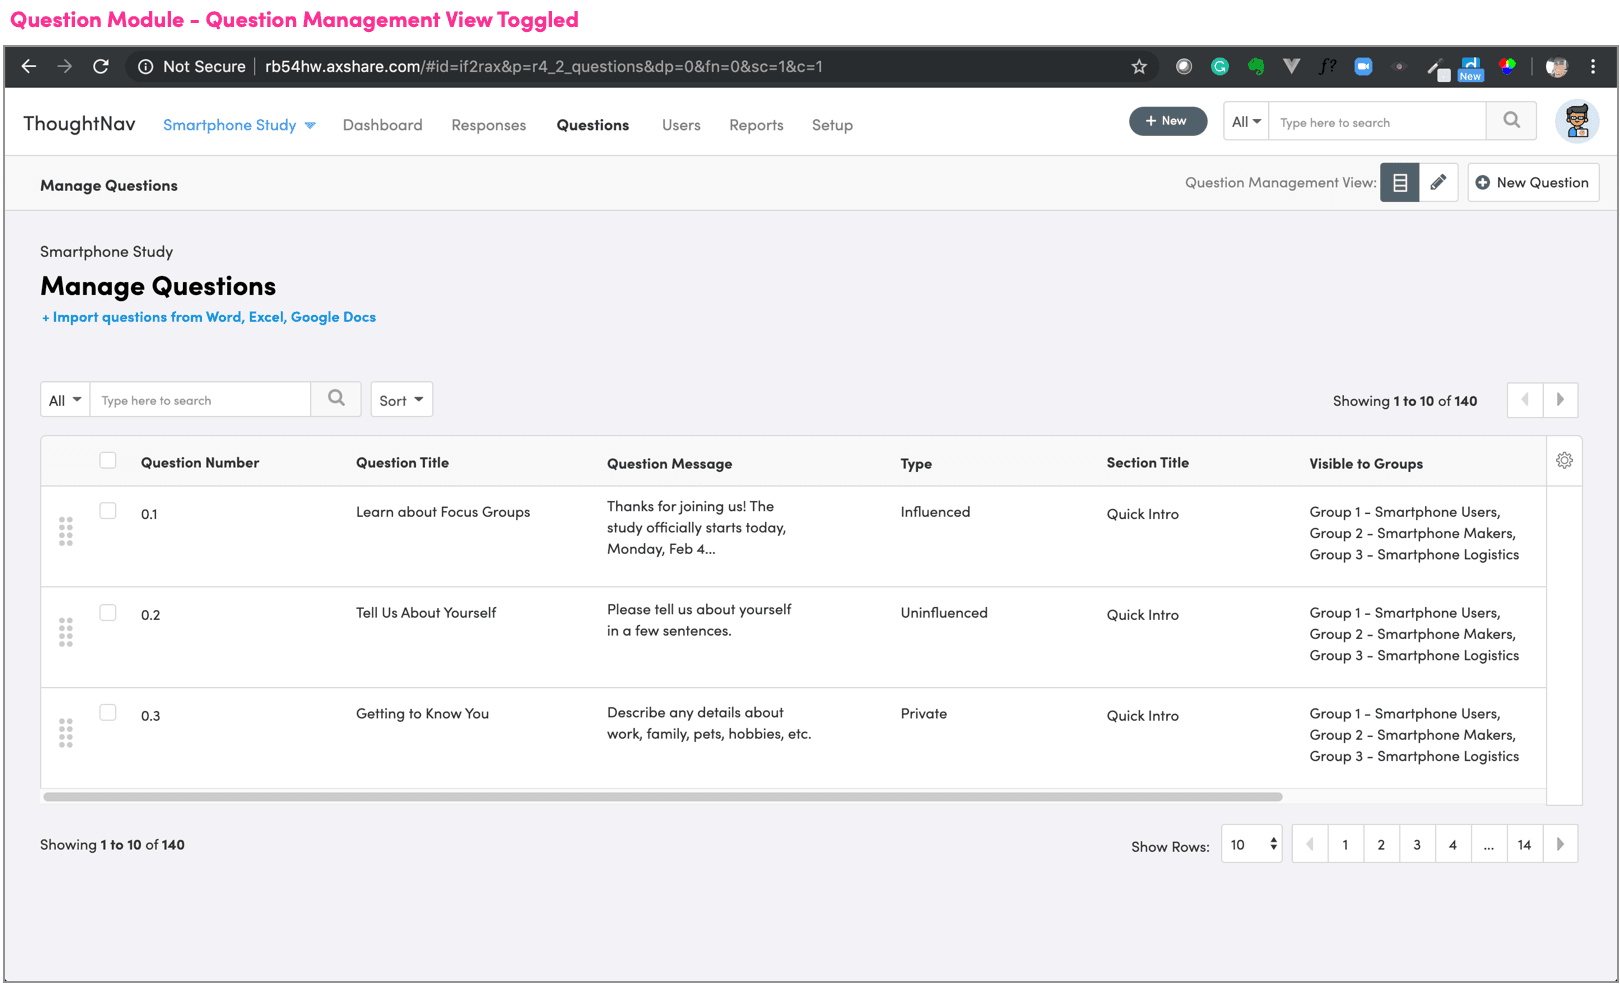
The process of managing each study's questions was improved by:
Optimizing the layout for enhanced readability.
Enabling bulk edits on multiple questions to reassign them to multiple groups, and participants.
Drag and Drop for quick reordering of questions.
Multiple viewing options to enhance question management and editing capabilities
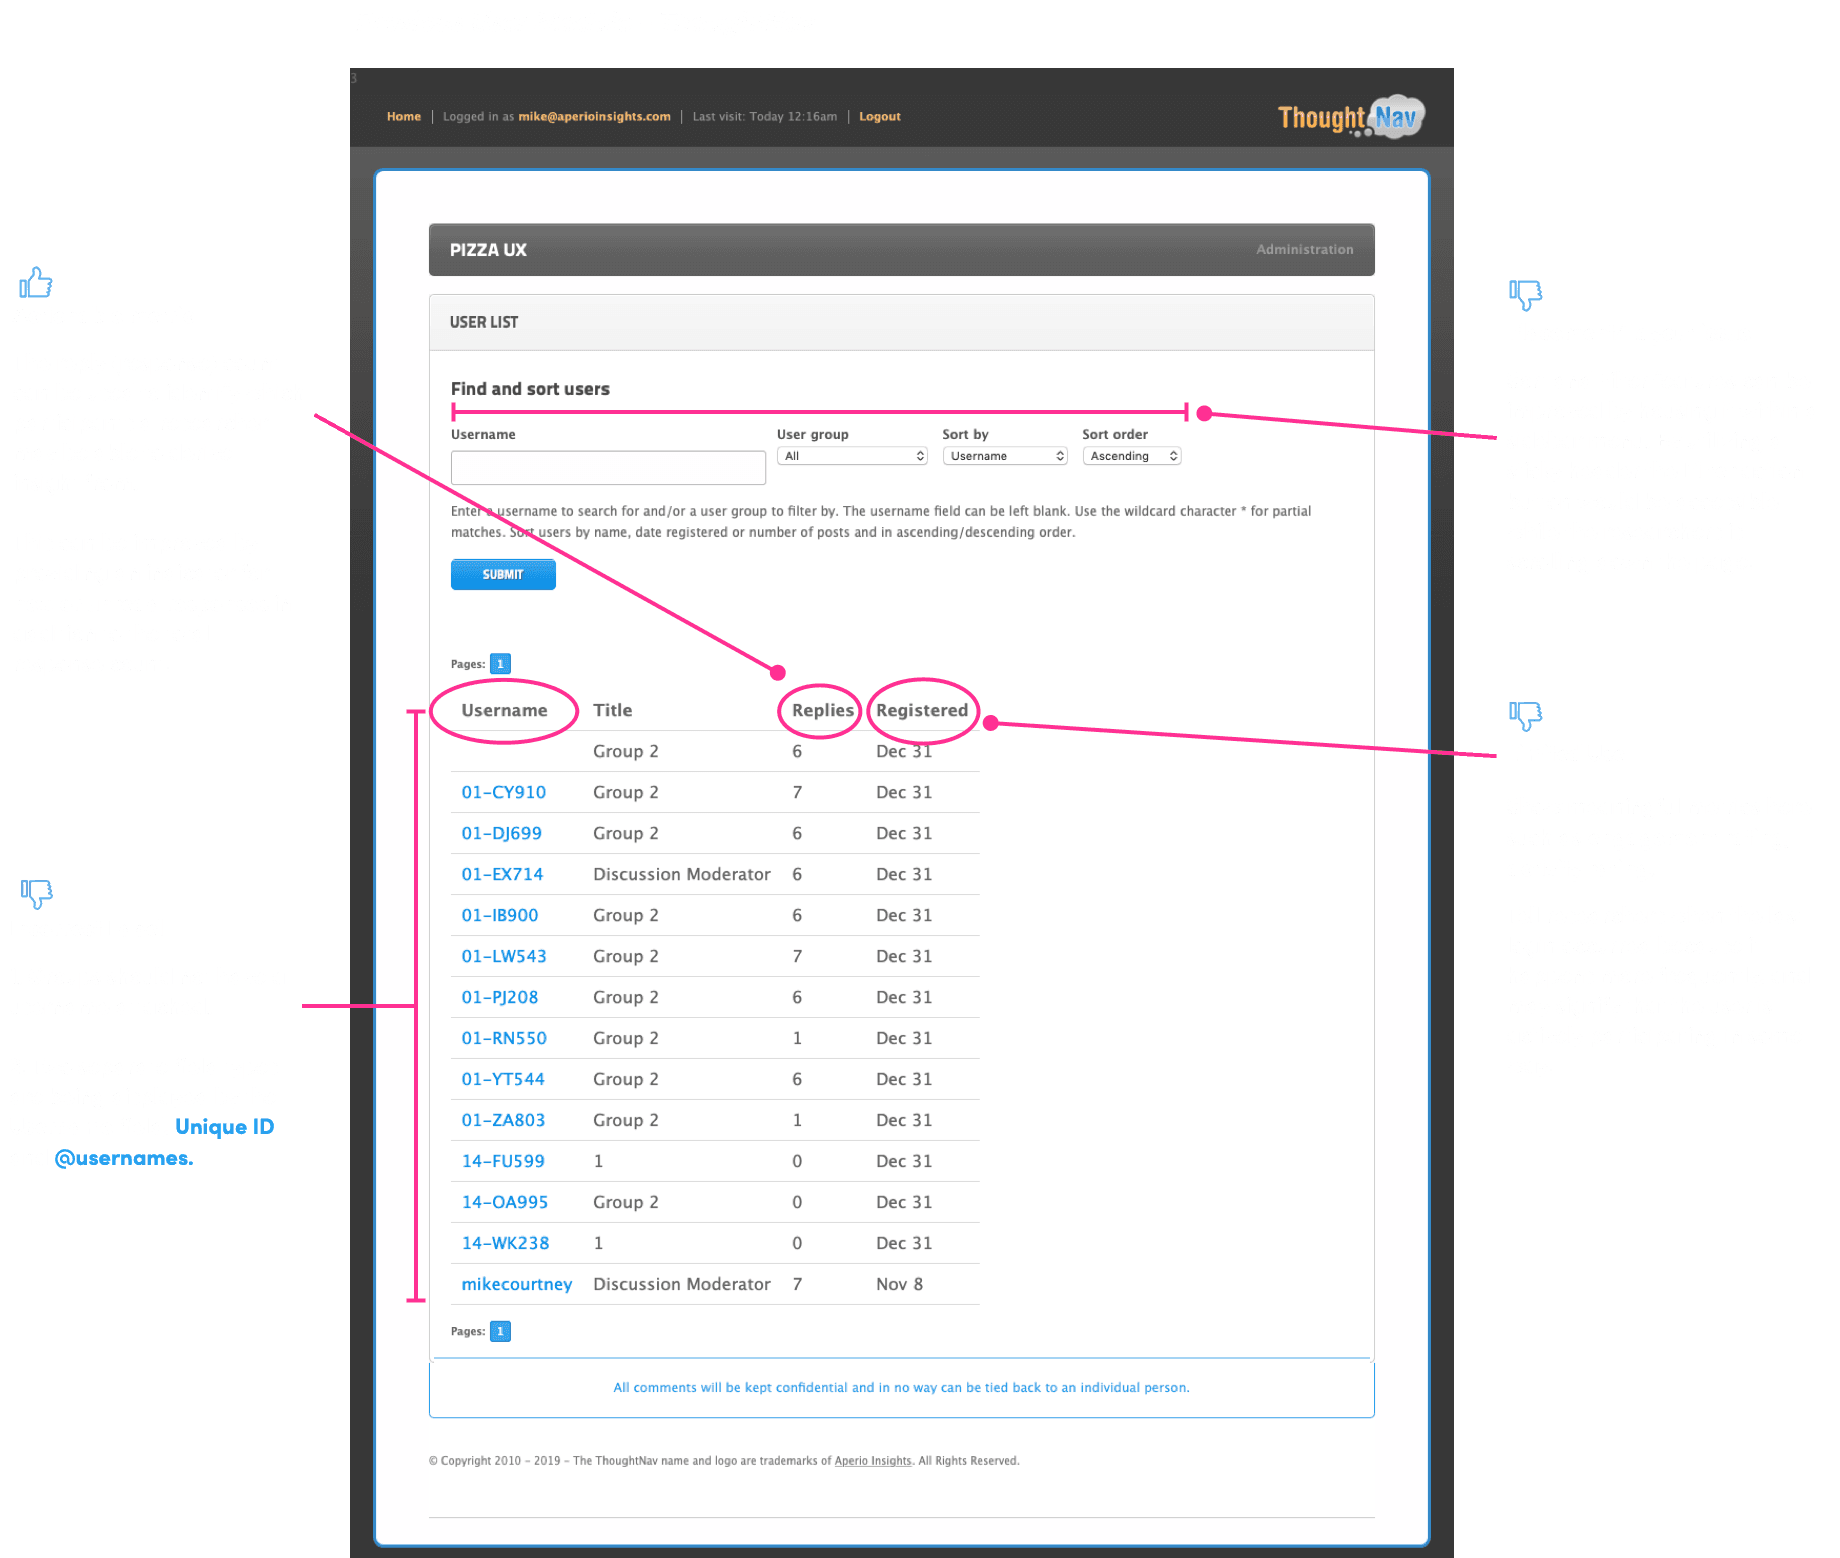
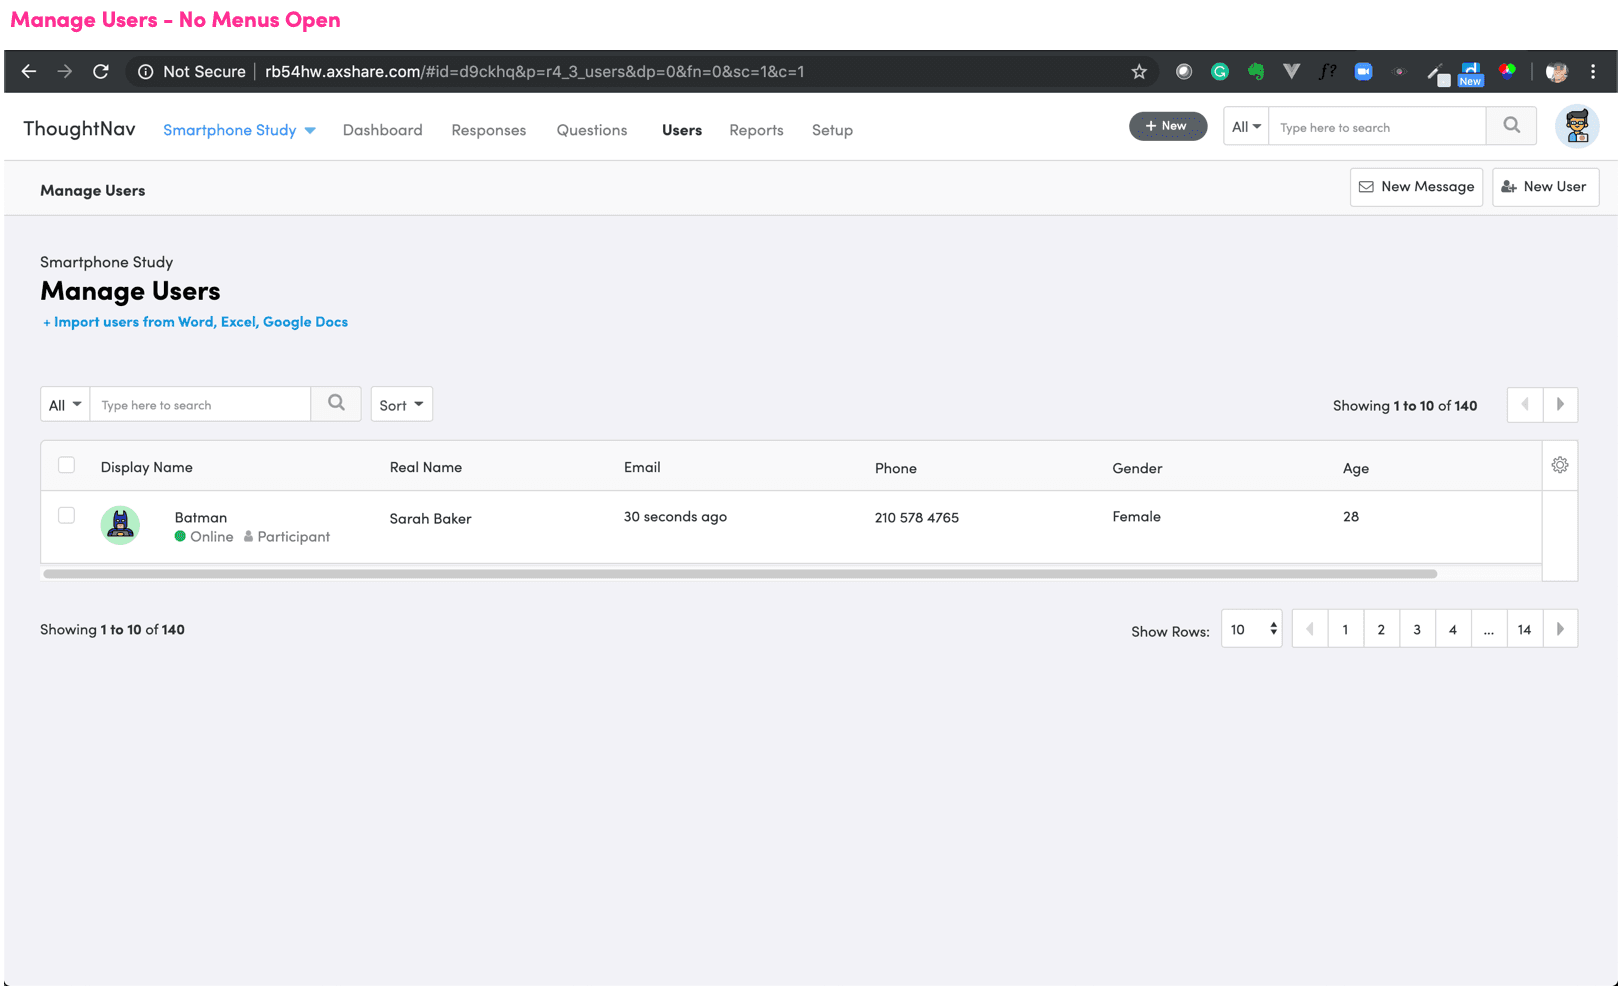
Throughout the duration of a study moderators may need to contact their participants and manage which participants have access to specific questions.
The previous system places actions like send email, send welcome message, and send live chat invite in completely separate areas throughout the application.
The experience was simplified by creating a new module labeled Users and placing related action buttons in the same area on the page. Researchers will grow accustomed to accessing actions within one area on the screen rather than having to navigate to multiple pages to complete simple and related tasks.
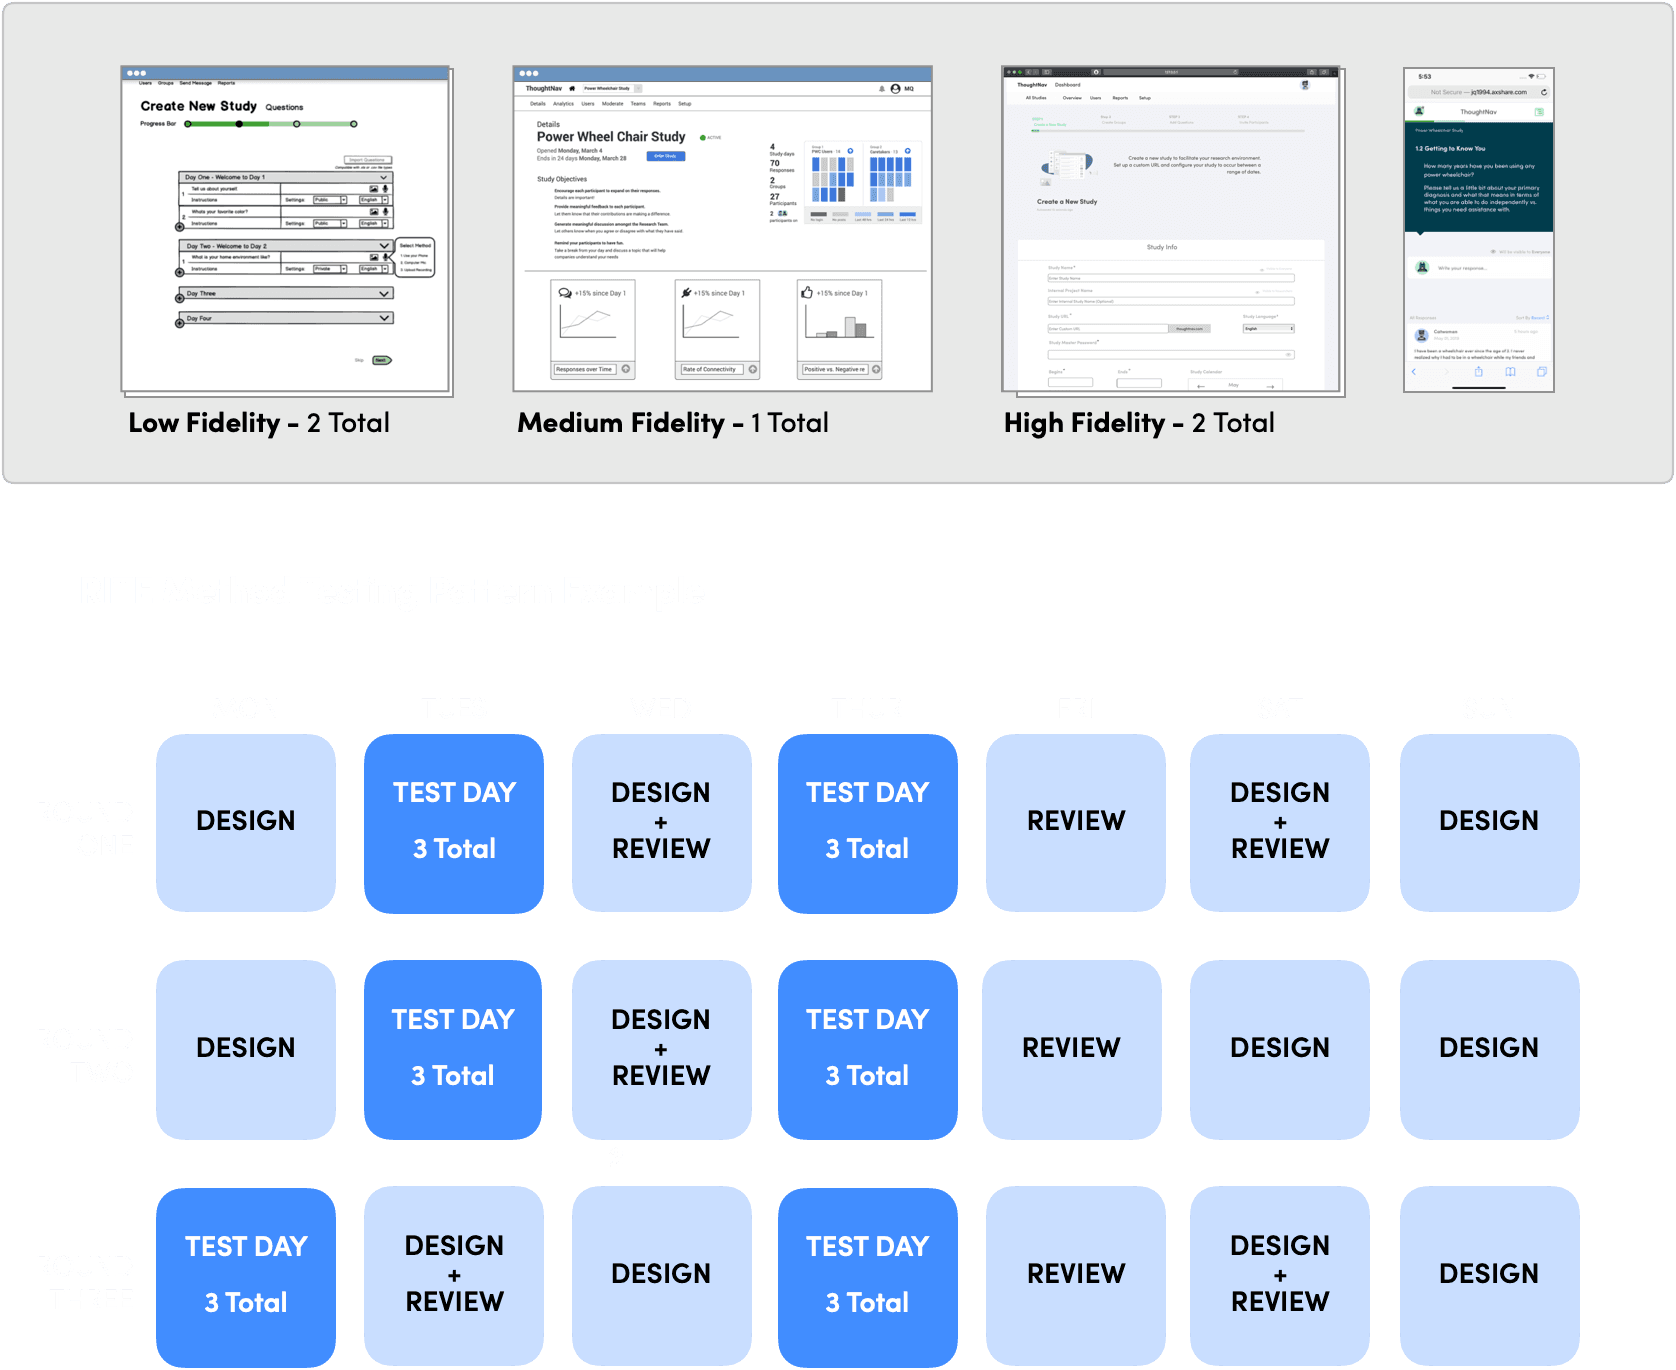
RITE stands for rapid, iterative, testing, and evaluation. The RITE method was used to make consistent updates to the design throughout the usability testing period.
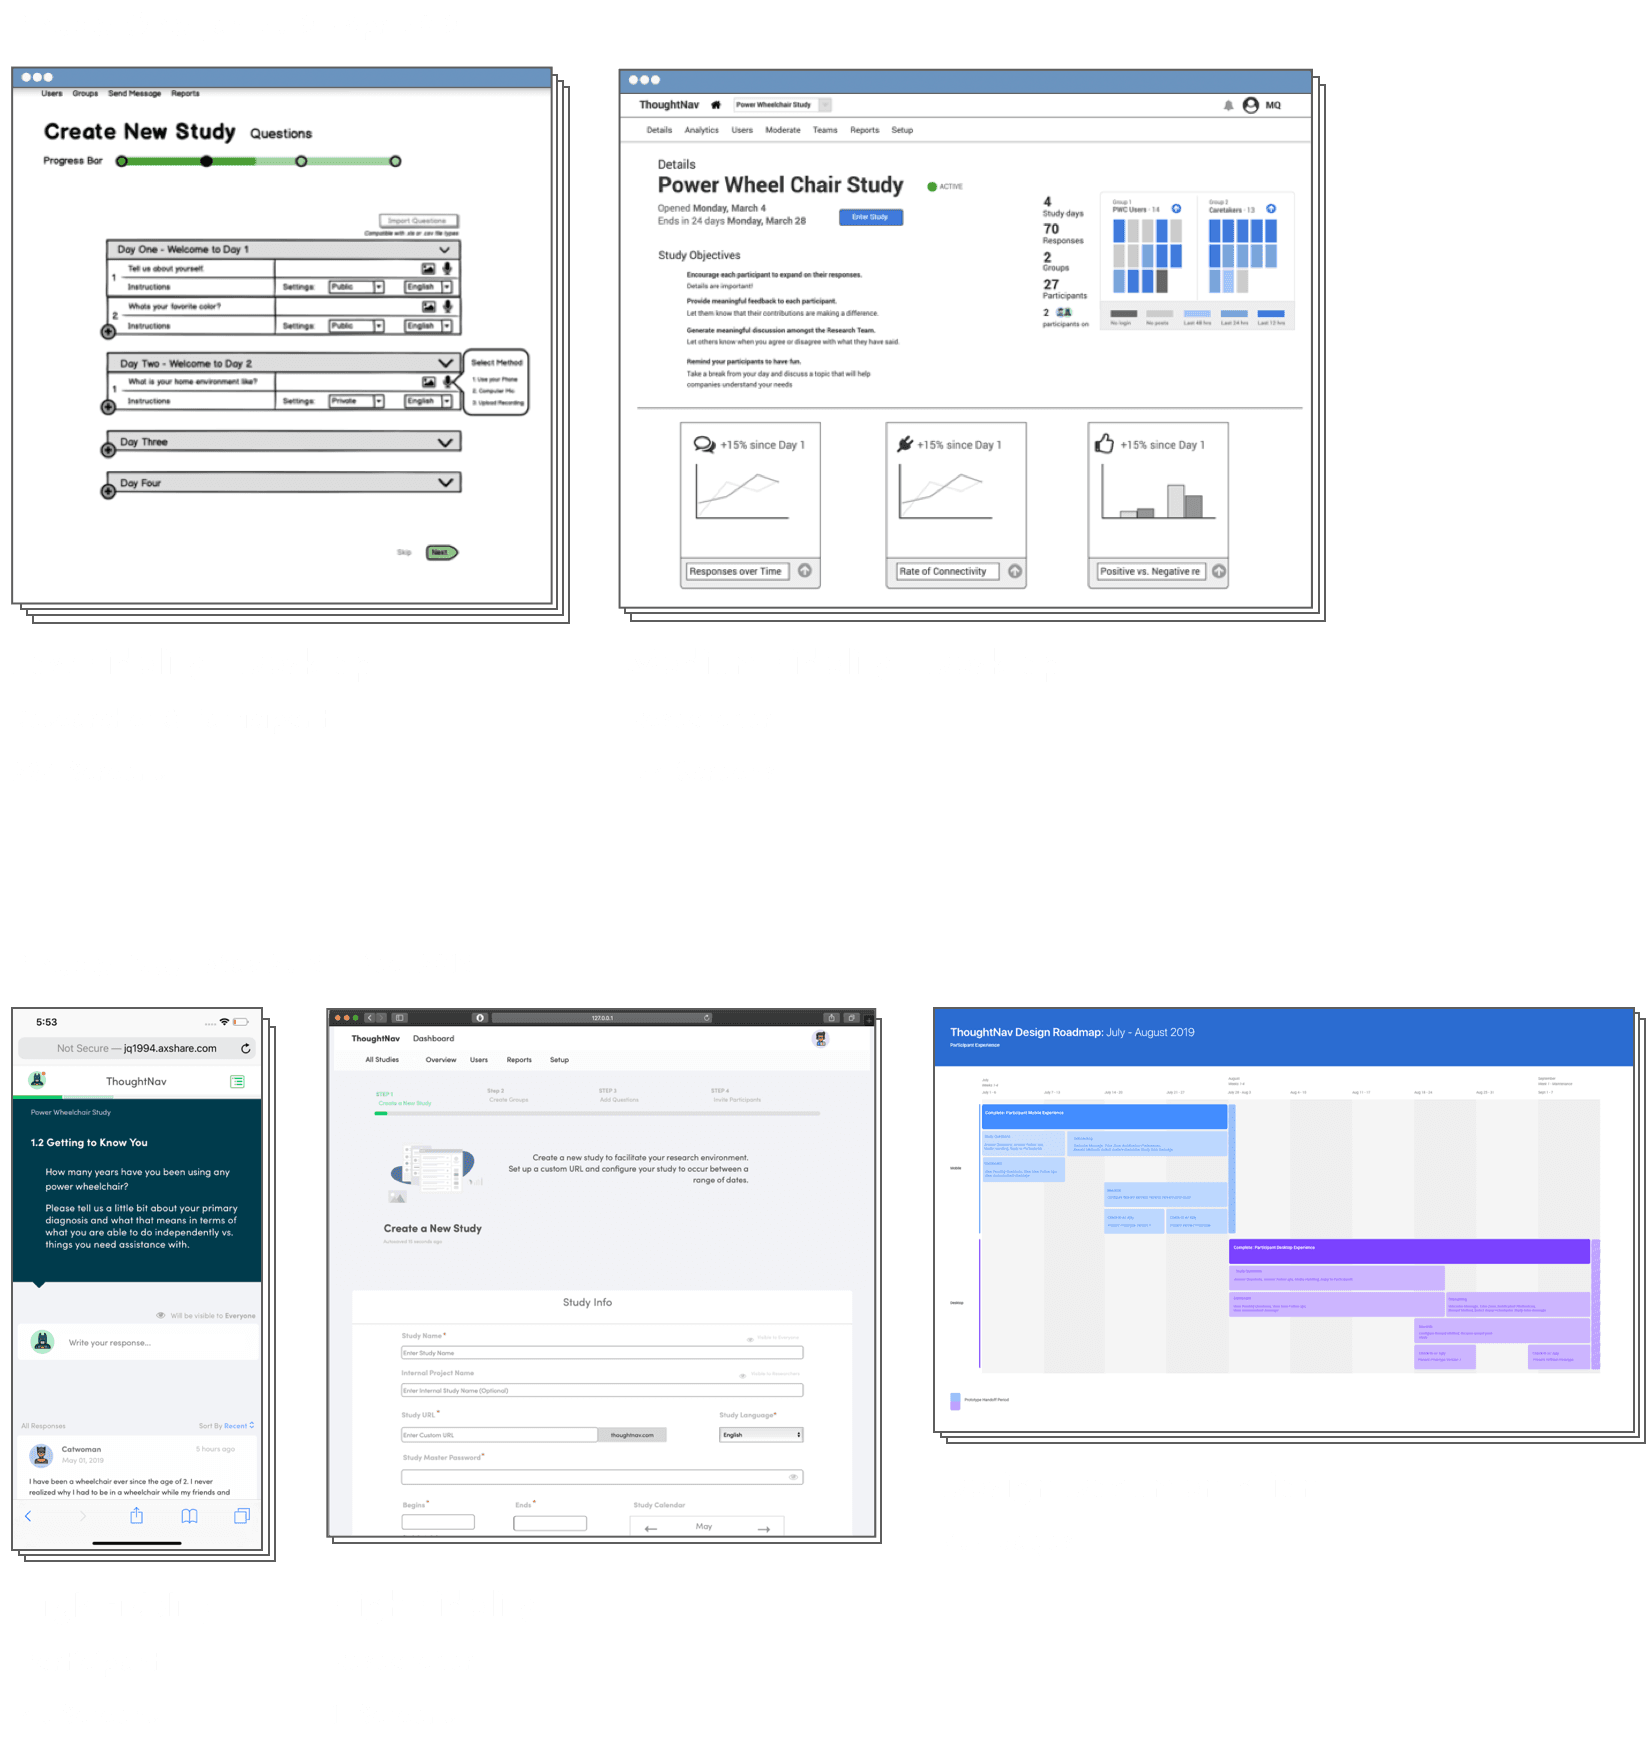
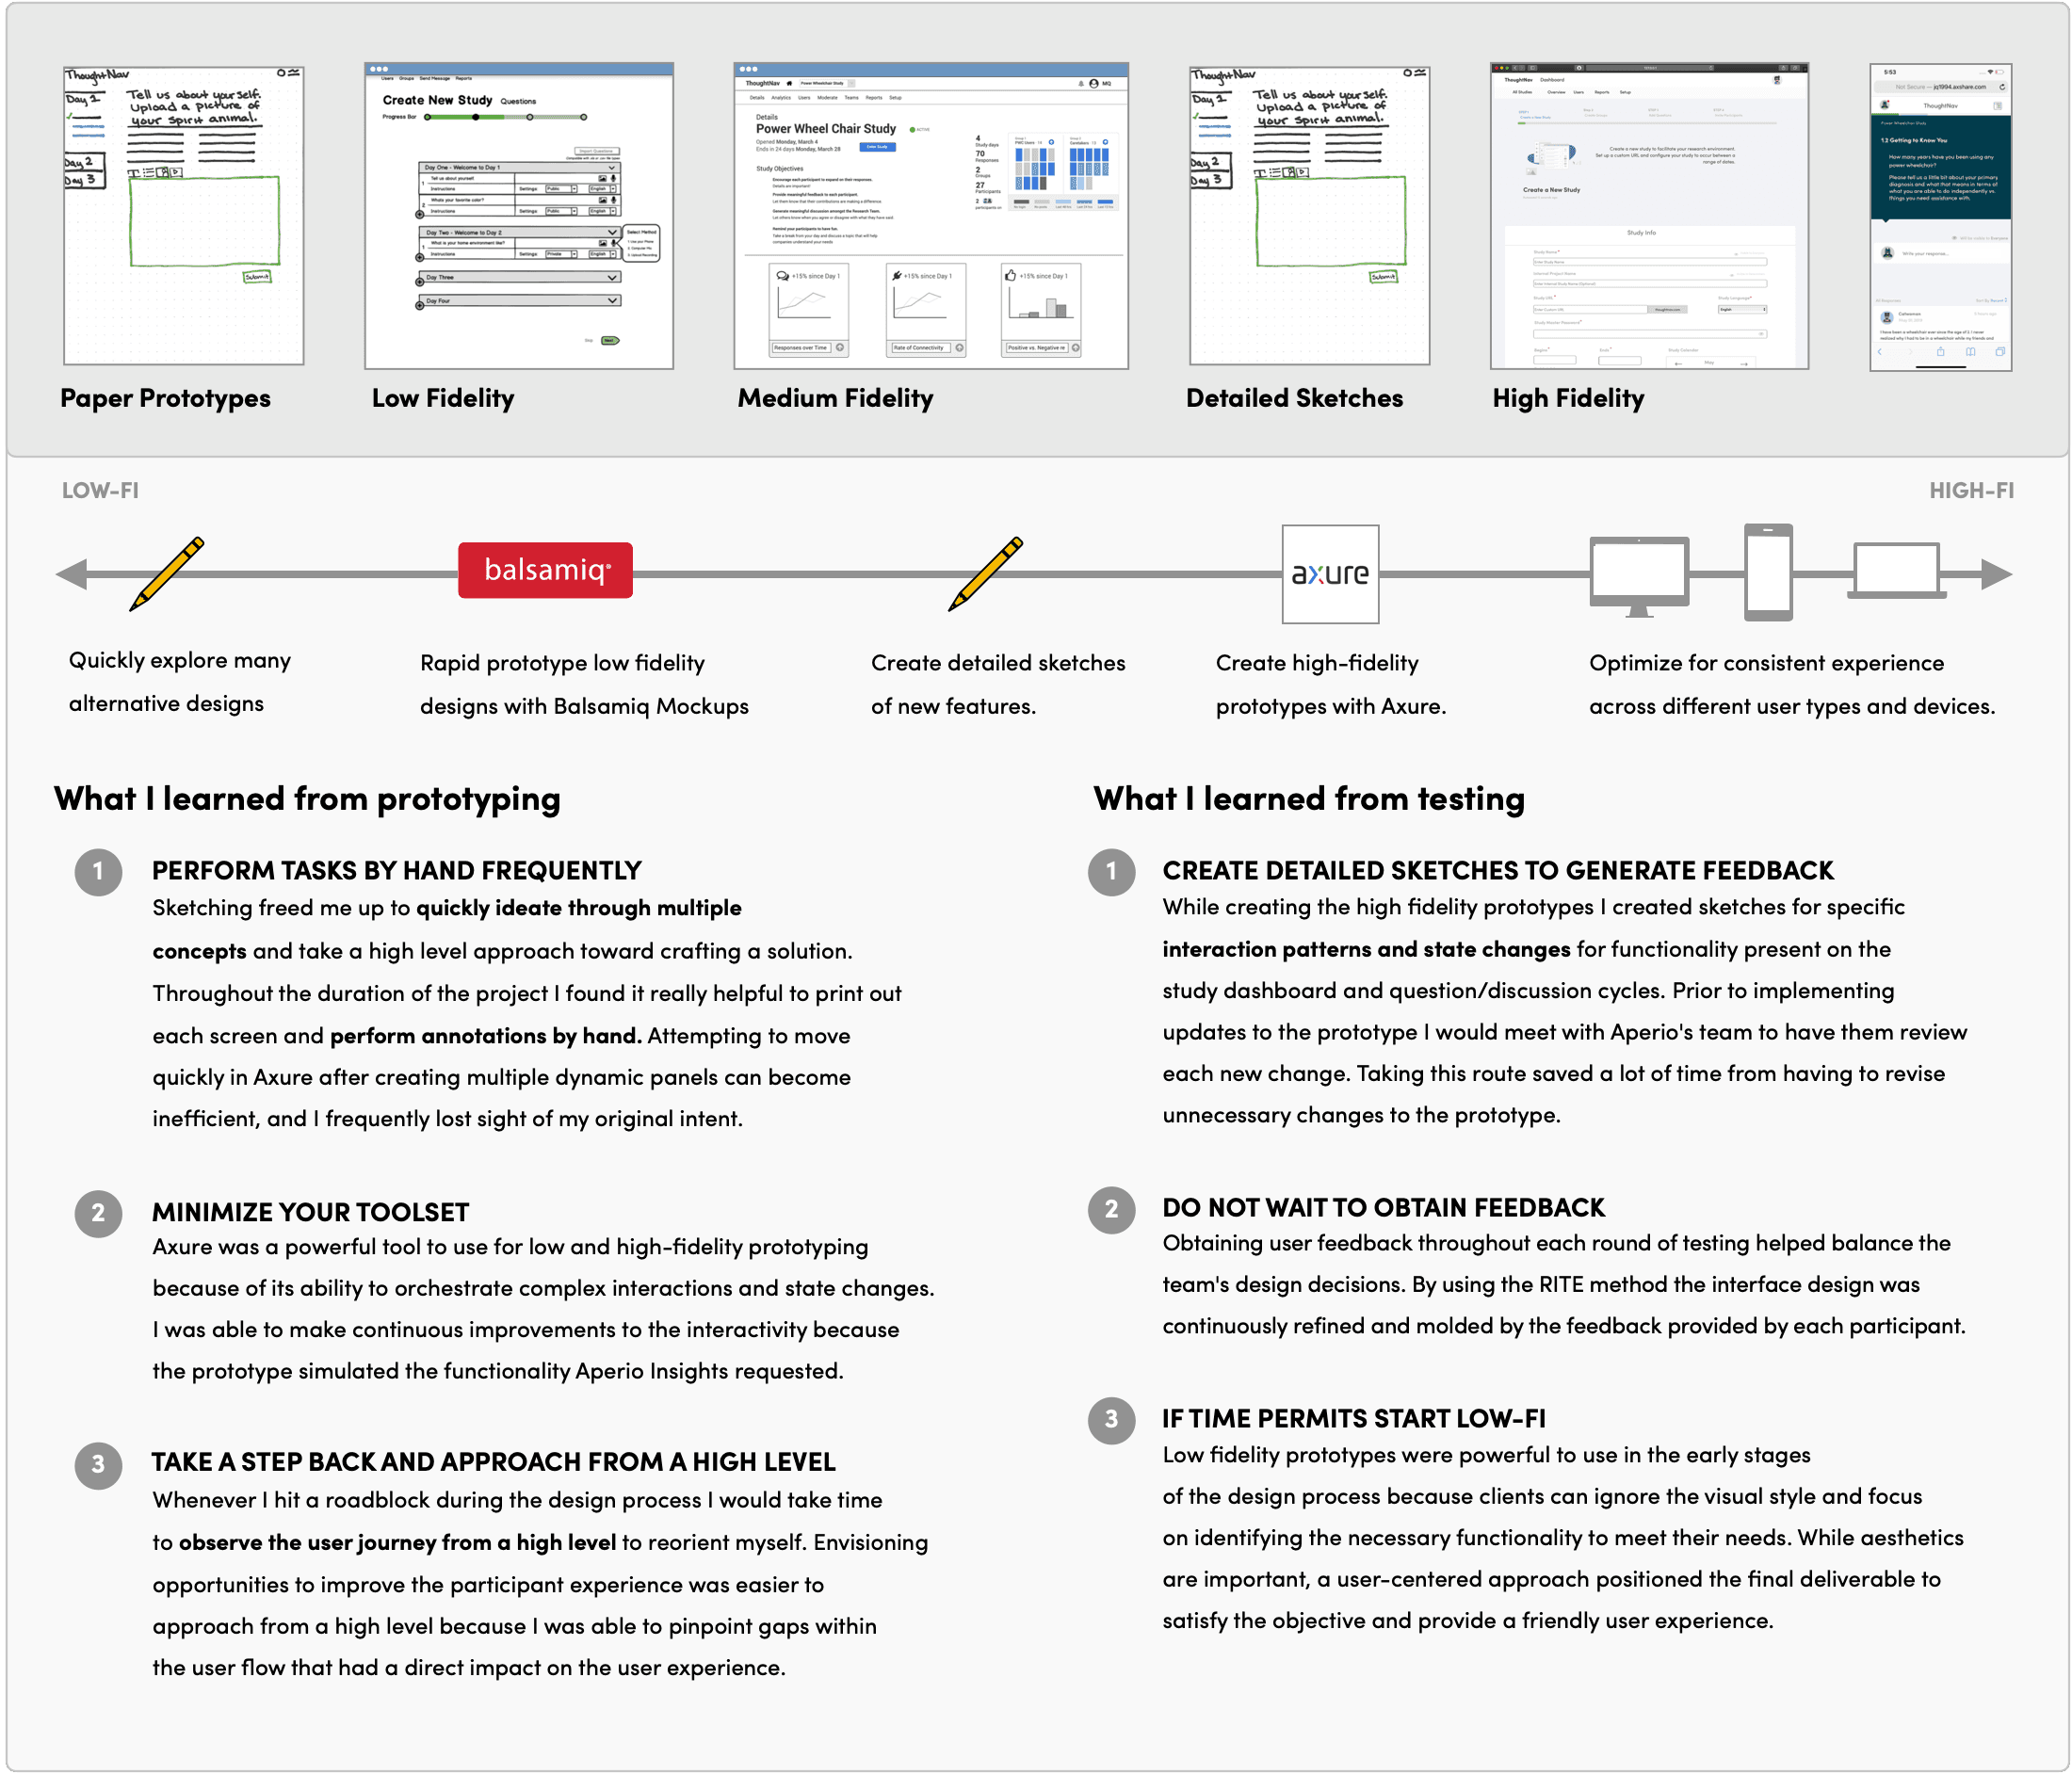
I created a total of 5 prototypes that were used for testing throughout the duration of the project.
Low Fidelity - Participants, Researchers
Medium Fidelity - Researchers
High Fidelity - Participants, Researchers
The participant and researcher experiences were tested a total 19 times each. Interface improvements were made at the end of each round of testing.
Usability testing focused on testing the previous ThoughtNav system as well as the new system.
For participants, the main processes tested were:
Create new account
Complete Quick Intro questions
For Researchers, the main processes tested were:
Create new study
Manage participant responses
Manage study questions
One of the most important data points to measure is the amount of time it takes a user to perform core tasks within the redesigned ThoughtNav platform. I was able to gauge if improvements have been made by asking participants to perform the same core tasks while using the redesigned platform. Observing how each participant navigates the system, how many times they select an unnecessary item, and observing their ability to locate/return to information they have previously encountered is critical information for providing quantitative evidence of the redesign effort.
Sarah, 32, is a patient care assistant for a quadriplegic power wheelchair user. Her younger sister has a physical disability, so Sarah has some personal insight into complex health needs. She was recruited for a focus group study and participates in the evening, usually right before going to bed. She logs in with her mobile phone, which she otherwise uses primarily for social media and photos.
Michael, 37, is a senior researcher for Baylor Scott and White Medical Services. He has recruited participants for an online focus group about power wheelchairs. He will have two coworkers assist him with facilitating the study to ensure that the data derived from the study is accurate. Michael favors his personal laptop when doing research, so he will have access to his information at home and at work.
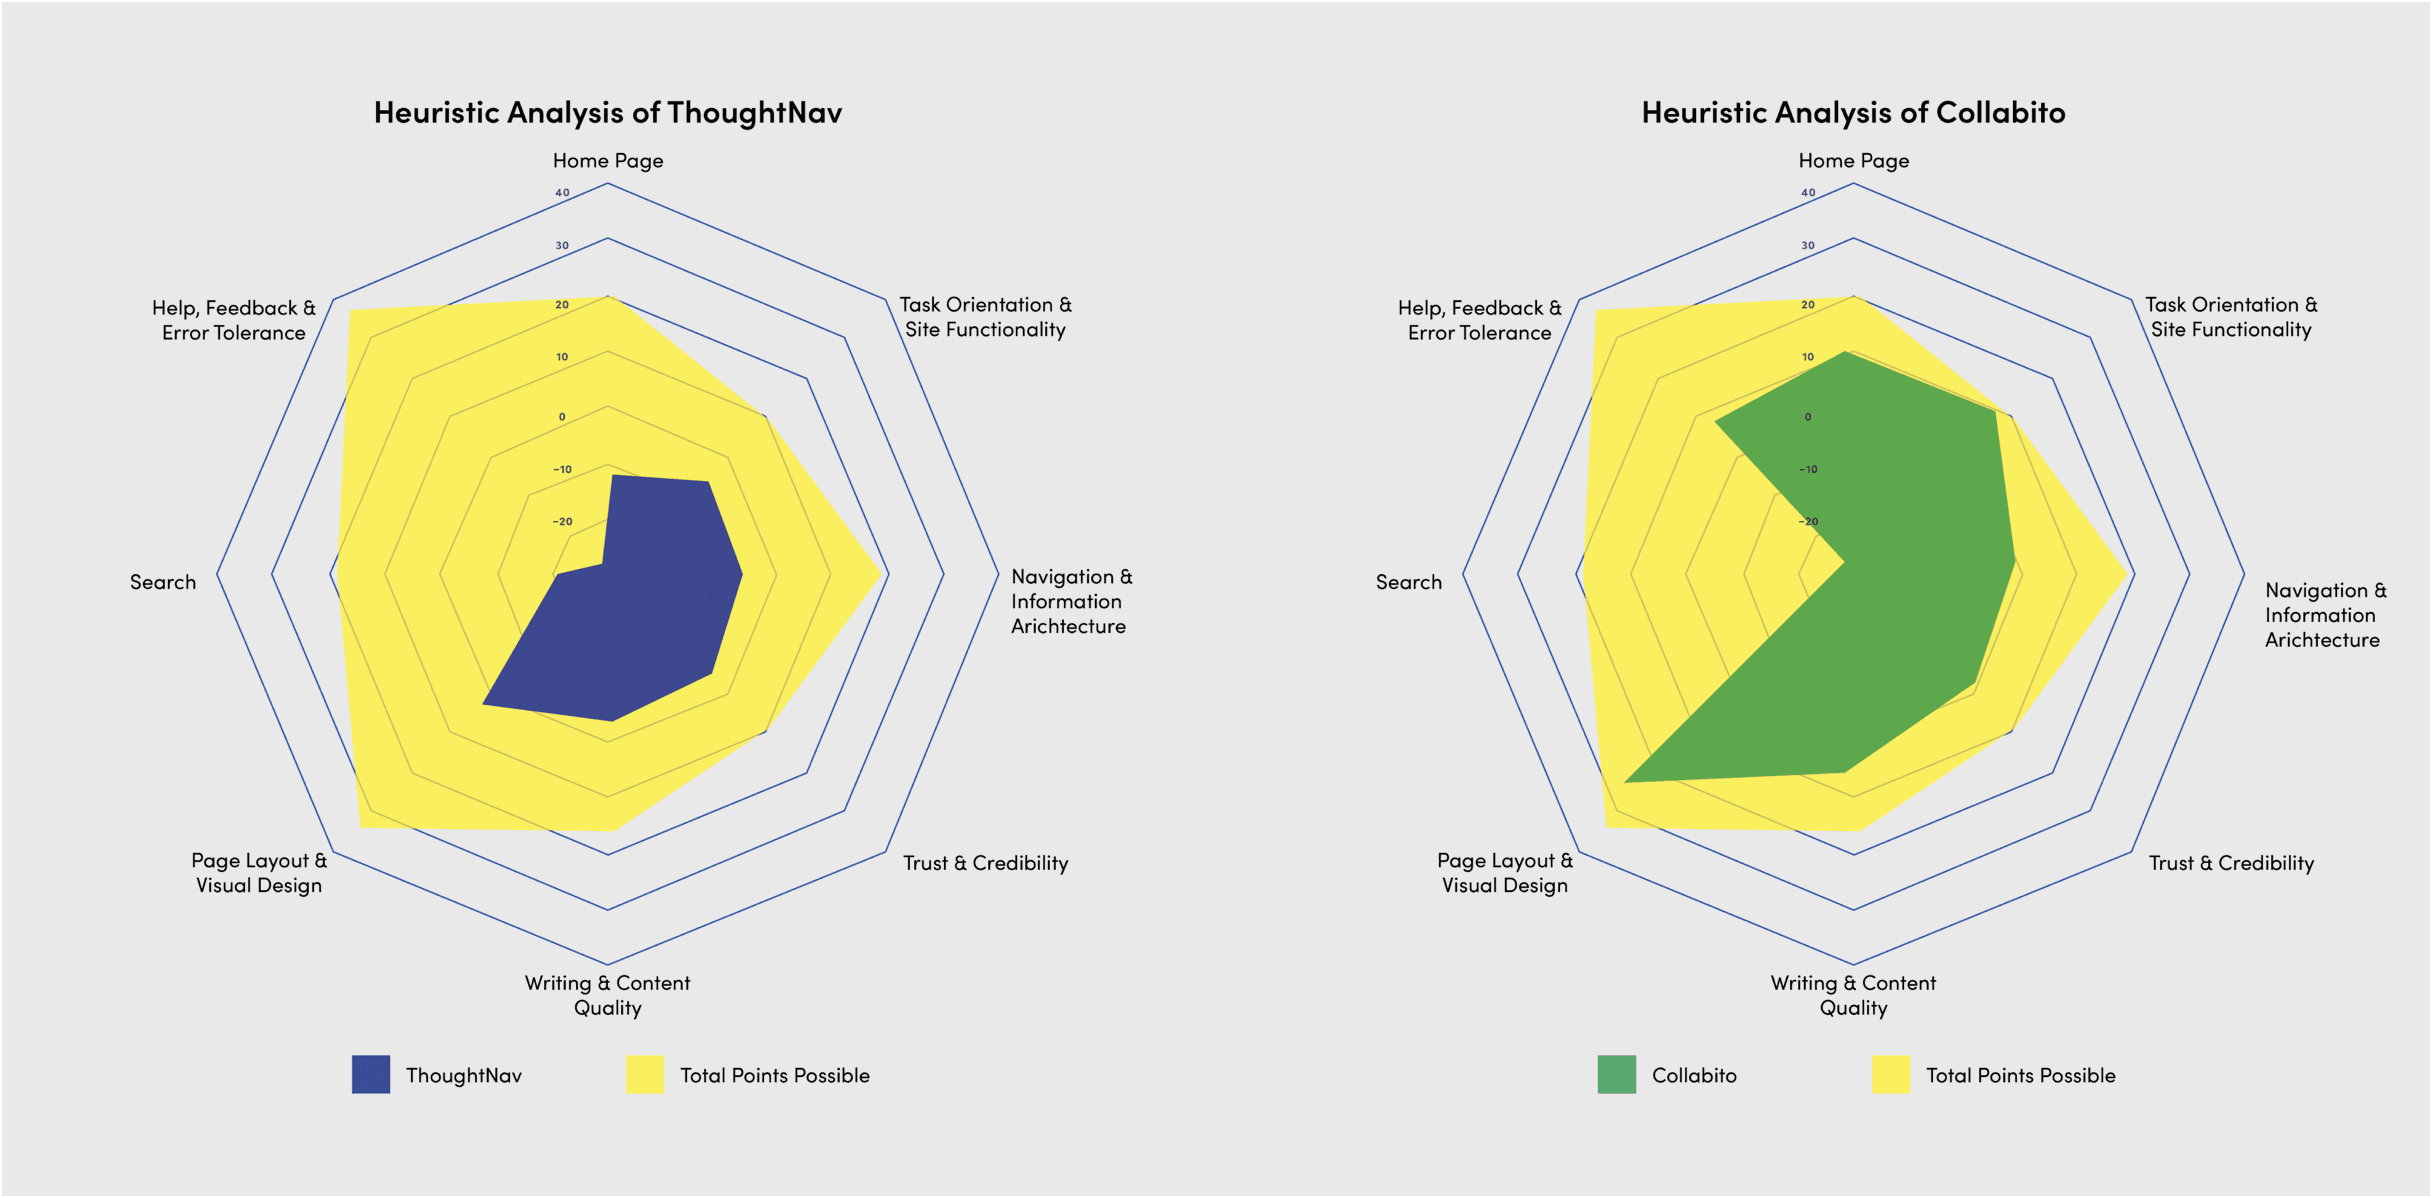
After completing the competitive analysis, our team performed a heuristic analysis on ThoughtNav and one of its primary competitors, Collabito.
The usability heuristics informing the analysis were created by referencing Nielsen Norman Group's article Ten Usability Heuristics. A few examples of those heuristics are:
Visibility of system status - Informed metrics for Trust & Credibility, and Help, Feedback & Error Tolerance.
Aesthetic and minimalist design - Informed metrics for Page Layout & Visual Design.
Collabito scored higher than ThoughtNav in every regard, especially in the areas of page layout and task orientation. After learning this information, I mapped out all of the pages within ThoughtNav and began the process of identifying an optimized user journey throughout the system.
Aperio Insights
8 months
Interaction Designer
UX Researcher
Client
Timeline
Roles
ThoughtNav is a research tool used by the team at Aperio Insights to streamline the process of conducting online focus groups. The ThoughtNav system has not been updated in over a decade, does not provide a user-friendly experience, and is not at all optimized for mobile devices.
As a result, many participants find it challenging to perform all the tasks necessary to complete a study. In addition, researchers spend a great deal of time reviewing content rather than identifying insights.
Enhancing an online
focus group platform
Project summary
My approach
My reflection
Design research and strategy
Identifying the User Journeys
Deconstructing the system
Rapid prototyping & Usability Testing
High Fidelity Design Breakdown
Analyzing 25 similar systems
Mapping the experience
Identifying pain points
Balancing Competitive Data and User Feedback
Redefining the System's Architecture
Researcher interface design
Participant interface design
Participant interface design
Participant interface design
Researcher interface design
Researcher interface design
Response management
Study dashboard
Utilizing Multiple Question Types
Global navigation
Question management
User management
Testing with the RITE Method
Usability Testing
Sarah’s participant journey
Micheal’s research journey
How does ThoughtNav compare?
Step 01
Step 02
Step 03
Step 04
Step 05
Measuring the impact

